Products
Solvers
Learning Center
Application Gallery
Knowledge Base
Support
License Agreement
Release Notes
Update and New
English
中文
Contact Number
+86-13776637985
Email
info@simworks.net
 Enterprise WeChat
 WeChat Service Account
This section describes Time monitor.
Use Time monitor to record electromagnetic field in time domain in a specified geometric space.
Select Time monitor from the solver tab, create a Time monitor in the Composite viewer, and set relevant parameters in a properties editing interface that automatically pops up.
The General tab is about general settings for the Time monitor.
| Name | Description |
|---|---|
| Data type | Record data type, which is Time-domain by default; this is a read-only parameter. |
| Spatial interpolation | Select types of spatial interpolation by drop-down: None: no spatial interpolation is performed; record electromagnetic field components at different locations within the Yee cell; Mesh cell: record each component of the electric and magnetic fields at different locations on the Yee cell. To accurately calculate the Poynting vector, you can choose to interpolate electromagnetic field components to the same location on the Yee cell. After selecting this option for spatial interpolation, field values are interpolated to the nearest Yee cell boundary. |
| Record data in PML | Record data in the PML region, which is an advanced setting and not checked by default. |
| Name | Description |
|---|---|
| Components | Field components: Ex, Ey, Ez; Hx, Hy, Hz; Poynting vector: Px, Py, Pz. |
The difference between Time monitor and the FDFP monitor is as follows:
| Name | Description |
|---|---|
| Stop time type | Set ways to stop simulation. Set stop time: User-defined time for stopping simulation; End of simulation: The moment the simulation actually ends is used as the stop time. |
| Start time | Time when recording begins. |
| Stop time | Time when recording stops. This option is enabled when choosing Set stop time for Stop time type. |
| Name | Description |
|---|---|
| Min sampling per cycle | Minimum amount of sampling per cycle; used to set number of sampling points per cycle. Default value is 10. |
| Sampling rate | Representing amount of sampling per unit time for a continuous signal. |
| Sample time(per # of dt) | Time interval of sampling during simulation, that is, after how many time steps a sample is taken from the field. |
| Name | Description |
|---|---|
| Per # of dx/dy/dz | Interval at which sampling is performed in the X/Y/Z direction during the simulation process, that is, after how many discretization steps a sampling is conducted. |
Geometry is the geometric setting tab for Time monitor. Please refer to geometric dimensions setting of the monitor.
Use Time monitor to save time-domain information of the simulation process.
After completing simulation, you can view the returned result in the Data visualizer of Time monitor. Types of result data include:
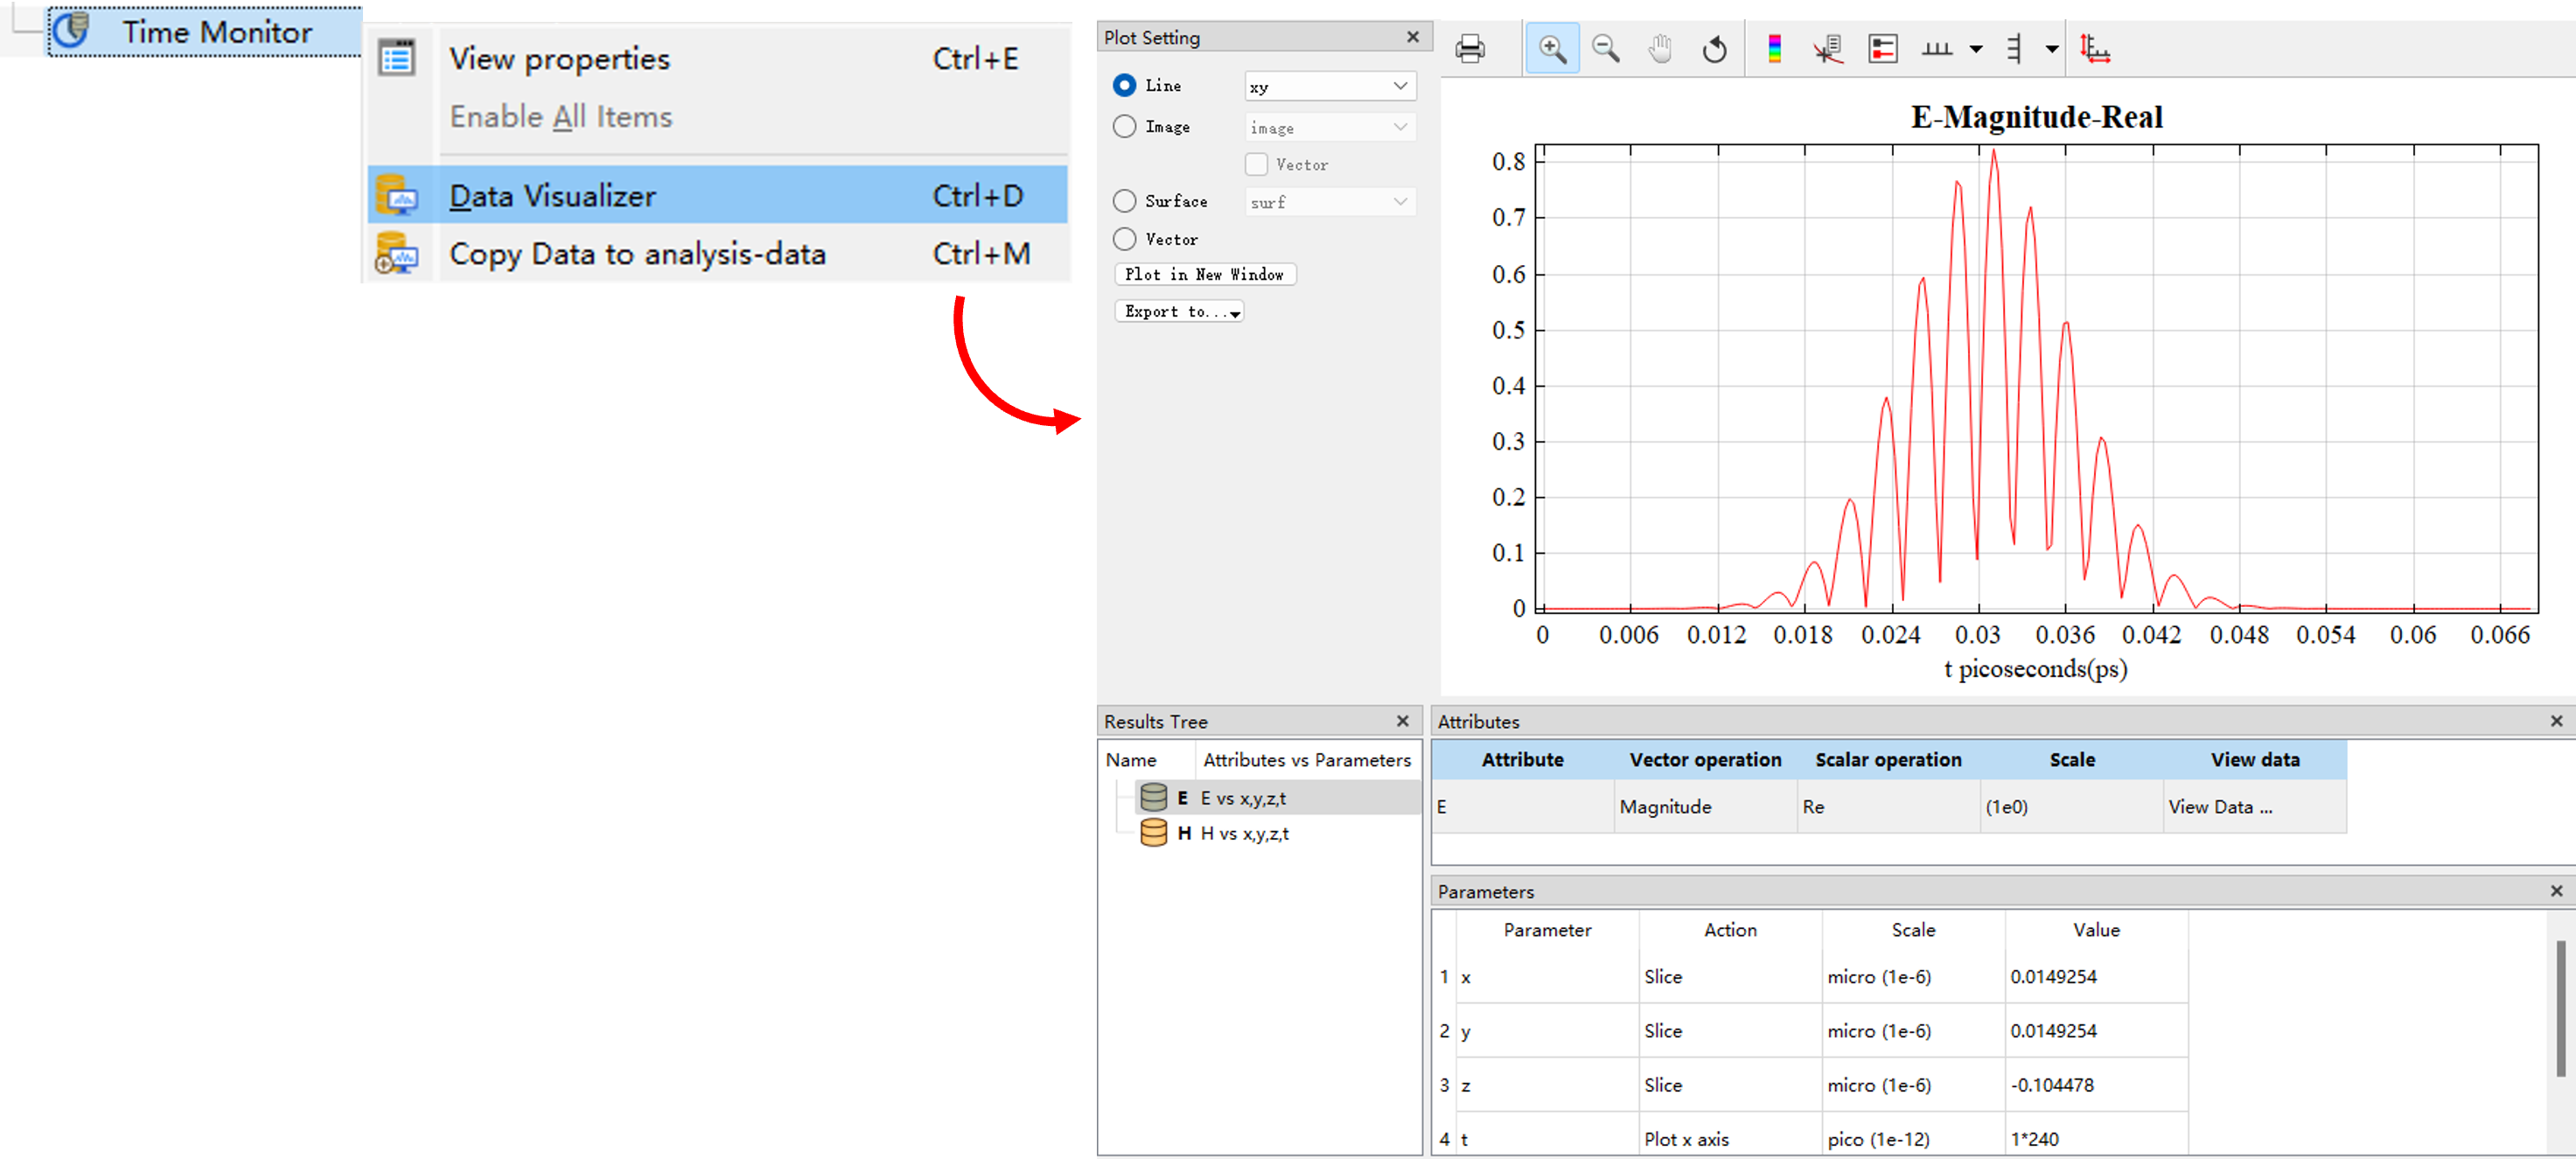
In the Data visualizer of the Time monitor, you can view field distribution in time-domain by the following operations:
In this case, FDTD is used to analyze the resonance spectrum of a one-dimensional Bragg grating resonator based on optical waveguide, and to calculate resonance frequency and quality factor Q. Signal data can be viewed from the Time monitor. For specific details, please refer to Bragg Microcavity.

