Products
Solvers
Learning Center
Application Gallery
Knowledge Base
Support
License Agreement
Release Notes
Update and New
English
中文
Contact Number
+86-13776637985
Email
info@simworks.net
 Enterprise WeChat
 WeChat Service Account
This section describes sampled data materials.
Sampled data is one of the most important types of materials, obtained on experimental measurements, which can truly reflect the physical properties of materials in the actual environments. Since sampled data material is derived from experimental data, measurement data may vary with different materials under different test conditions. When simulation, users need to select the most suitable data from multiple data of the same material.
Material fitting must be considered when using sampled data. The software allows users to fit experimental data of materials into stable material models using appropriate fitting algorithms. The software offers automatic fitting functionality. However, it is recommended to check the fitting error before simulation to determine whether it meets simulation requirements.
When selecting built-in sample data material for simulation, the software will automatically fit the material model, i.e., using a polynomial function to obtain fitting results with an RMS error less than the specified tolerance. For more details, please refer to Material fitting.
Users can choose the desired material model by selecting Add material>Add material from global material library.
Material data provided in this software are primarily sourced from references listed at the end of this section.
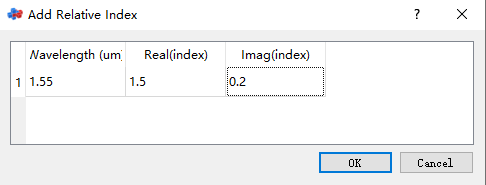
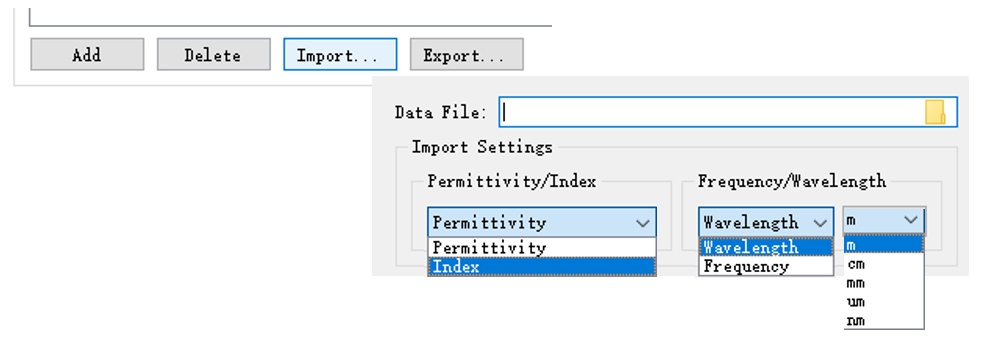
The software allows users to customize the data of a sampled data material, which can be achieved by using either the Add or Import... option.
In addition to general sampled data materials, the software also allows users to set up sampled 2D data materials.
In the Material library window, you can add the desired sampled 2D data material by selecting Add material>Add new material>Add sampled 2D data.
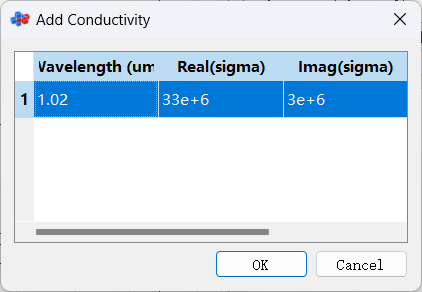
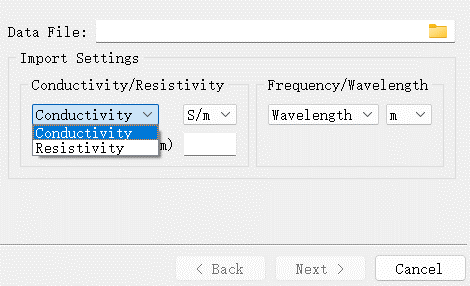
The software enables users to customize data of a sampled 2D data material, which can be achieved by using either the Add or Import... option. The software allows input of Conductivity or Resistivity data for sampled 2D data materials.
In the Material Data tab, you can set up the thickness, name, color, and other properties of the material.
| Name | Symbol | Units | Range | Default | Description |
|---|---|---|---|---|---|
| Layer thickness | Real number, | 0 | Physical thickness of the 2D material |
It is recommended checking the fitting of the sampled data material before conducting simulations, especially for projects involving complex structures and large amounts of calculations.
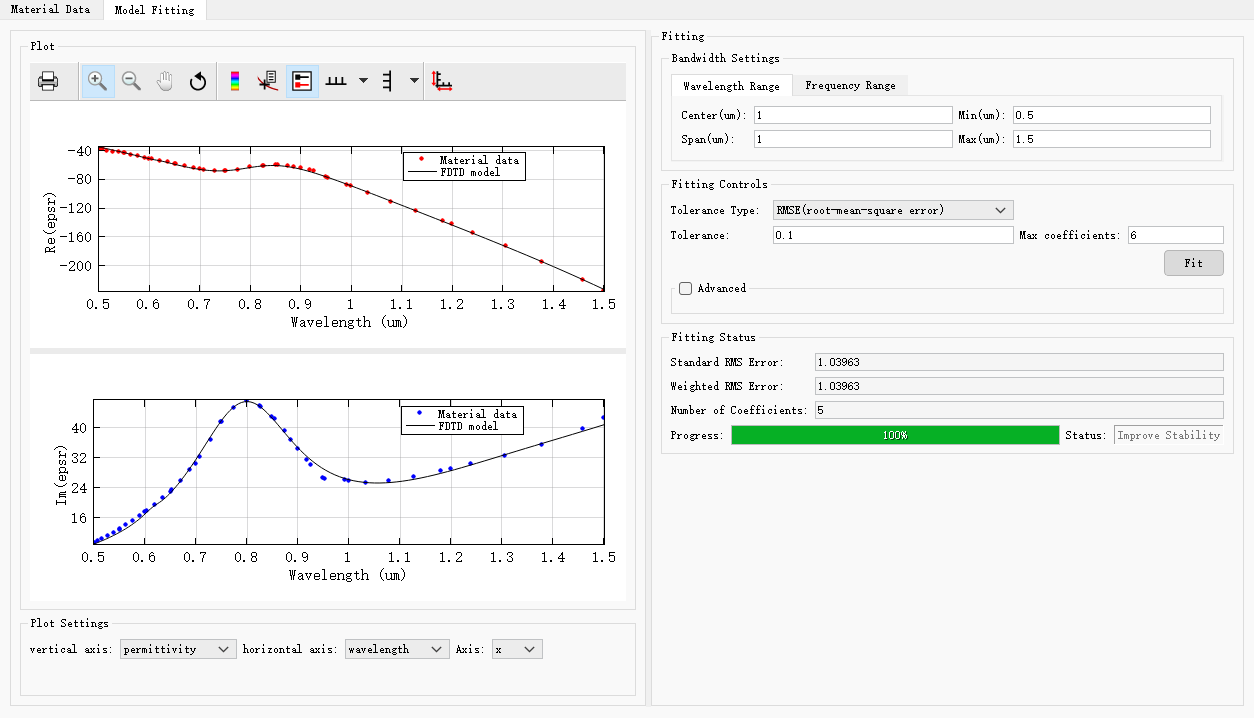
Before conducting simulations for a specific project, you need to double-click the desired material in the project material library, then access the Model fitting tab and click Fit to view the fitting of the material under the default fitting parameters provided by the software.
For example, the fitted model for Al(Aluminium)_Palik , under the software's default fitting parameters (tolerance = 0.1, max coefficient = 6), exhibits strong agreement with the experimental data, which indicates a small fitting error (RMS error). The fitting results of this material meet the simulation requirements and can be used directly for simulations.
In addition, an Index monitor can be added to check the material data actually used in the simulation.
If fitting of a sampled data material is unsatisfactory, modifying the relevant fitting parameters may help to fit the material more accurately.
Here are some tips:
Reduce RMSE/RRSE
By appropriately increasing tolerances between experimental data and fit models; the fitting process can be completed successfully with fewer coefficients.
Adjust Max coefficients
Using too many coefficients will cause the fitting process to be overly sensitive to noise present in the data, while using too few coefficients may result in larger errors in the fitting. Therefore, it is necessary to find a more suitable fitting model by adjusting the coefficients.

