/
端口设置
端口设置光源模式扩展
端口设置 #
本节是关于端口设置的介绍。
端口可同时充当模式源和FDFP监视器。端口可以单独使用,也可以与S矩阵扫描工具结合使用,通过模式扩展提取器件的S参数。
在求解器选项卡中选择Port,在复合视图中创建端口,然后在弹出的编辑窗口中设置更多参数。
端口 #
添加端口 #
在求解器选项卡中选择Port,在复合视图中创建端口,此时会自动添加一个名为Port group的端口组,并且新添加的端口被包含在这个组中。
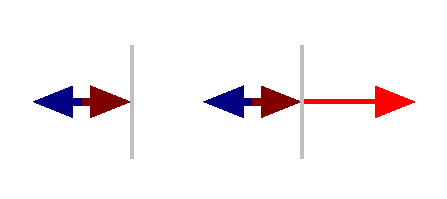
默认情况下,源端口将在注入方向上有一个红色箭头,下图右侧的端口即为源端口。
端口组的设置 #
在软件仿真中,支持用户自定义端口组中的源端口,一次只能使用一个端口作为源端口。
端口组名称 #
General选项卡中的Name显示端口组的名称。
光源属性 #
Source properties用于设置光源属性。
- 源端口
Source port选项卡用于选择现有端口作为源端口。
| Name | Description |
|---|---|
| As source port | 从列表中选择现有端口作为源端口。 |
| Incident mode ID # | 显示注入模式的编号。 |
- 波长/频率
Wavelength/Frequency选项卡用于设置光源端口的波长和频率。
关于光源的波长/频率设置的具体细节,请参阅模式扩展的设置。
监视器属性 #
Monitor properties用于设置监视器属性。
| Name | Description |
|---|---|
| Data type | 记录数据的数据类型,默认为Frequency-domain,只读参数。 |
| Spatial interpolation | 空间插值。 |
| Record data in PML | 记录PML区域内的数据。 |
分量 #
| Name | Description |
|---|---|
| Components | 电磁场分量:Ex、Ey、Ez;Hx、Hy、Hz;坡印廷矢量:Px、Py、Pz。 |
频率采样 #
| Name | Description |
|---|---|
| Min sampling per cycle | 每个周期的最小采样数;用于设置每个周期内采样的点数,默认值为2。 |
| Desired sampling | 期望采样;用于控制采样密度的参数。它指定了在仿真过程中对场进行采样的间隔或步长。 |
| Nyquist limit | 奈奎斯特采样极限;为了能够准确地重构一个连续时间信号,必须以不低于待分析信号最高频率两倍的采样率对信号进行采样。 |
| Sampling frequency | 采样频率;表示单位时间内对连续信号进行采样的次数。采样频率不低于待分析信号最高频率的两倍,以遵循奈奎斯特极限的要求。 |
| Sample time (per # of dt) | 采样时间;在仿真过程中进行采样的时间间隔,即在多少个时间步长之后对场进行一次采样。 |
端口设置 #
通用设置 #
| Name | Description |
|---|---|
| Name | 自定义端口的名称。 |
| Incident axis | 设置源端口的注入轴(注入平面的法向)。 |
| Direction | 指定源端口的注入方向,Forward为正向传播,Backward为反向传播。 |
| Amplitude | 设置源端口的振幅。 |
| Phase shift (degree) | 设置源端口的相位。 |
旋转 #
关于Rotation的设置,详情请参阅模式扩展的旋转部分。
多频点 #
| Name | Description |
|---|---|
| Multi-frequency field | 多频域;可以求解多个频率点的模式分布,在宽带仿真工程中建议勾选此项。 |
| Frequency points | 指定将计算多少个频率点的模式分布,增加频率点会增加仿真时间,建议在仿真初期设置较少的频率点。 |
模式选择 #
关于Select mode的设置,详情请参阅模式扩展的模式选择部分。
模式分析 #
点击Mode Analysis,进入模式分析页面,该页面允许用户选择添加所需的模式分析。
| Name | Description |
|---|---|
| Frequency analysis | 对特定的模式进行频率扫描;可以用来计算光在波导中传播时产生的色散、损耗等问题。 |
| Bent analysis | 对波导的弯曲半径进行扫描;可以用来计算光在不同弯曲半径的波导中传播时的有效折射率和损耗等问题。 |
此外,模式分析还支持用户进行自定义分析。
数据可视化 #
端口的数据可视化页面保存由仿真计算得到的数据集,Mode port返回的结果数据包括:
| Name | Description |
|---|---|
| Sourcepower | 光源能量与频率/波长的关系,仅源端口有该结果数据。 |
| E | 电场与频率/波长的关系。 |
| H | 磁场与频率/波长的关系。 |
| P | 坡印亭矢量与频率/波长的关系。 |
| Power | 功率与频率/波长的关系。 |
| T | 透射率与频率/波长的关系。 |
数据可视化页面ModeExpansion结果包括以下数据:
| Name | Description |
|---|---|
| N | 模式的功率。 |
| A_forward | 模式正向传播的复透射系数。 |
| A_backward | 模式反向传播的复透射系数。 |
| T_forward | 从输入端口到输出端口的传输功率。 |
| T_backward | 从输出端口到输入端口的传输功率。 |
| S | S参数。 |