Products
Solvers
Learning Center
Application Gallery
Knowledge Base
Support
License Agreement
Release Notes
Update and New
English
中文
Contact Number
+86-13776637985
Email
info@simworks.net
 Enterprise WeChat
 WeChat Service Account
This section describes the Index monitor.
In FDTD, use Index monitor to record material data in a specified geometric space.
Select Index monitor from the solver tab, create an Index monitor in the Composite viewer, and set relevant parameters in the automatically pop-up properties editing interface.
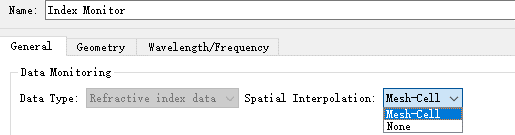
General tab is used for general setting of Index monitor.
| Name | Description |
|---|---|
| Data type | Record data type, which is Refractive index data by default. This is a read-only parameter. |
| Spatial interpolation | Select types of spatial interpolation by drop-down: None: No spatial interpolation is performed; record refractive index data at actual locations; Mesh cell: Monitor location is intercepted to the nearest mesh cell. |
| Record data in PML | Record data in the PML region, which is an advanced setting and not checked by default. |
| Record surface conductivity | Check to enable the option, and record surface conductivity. |
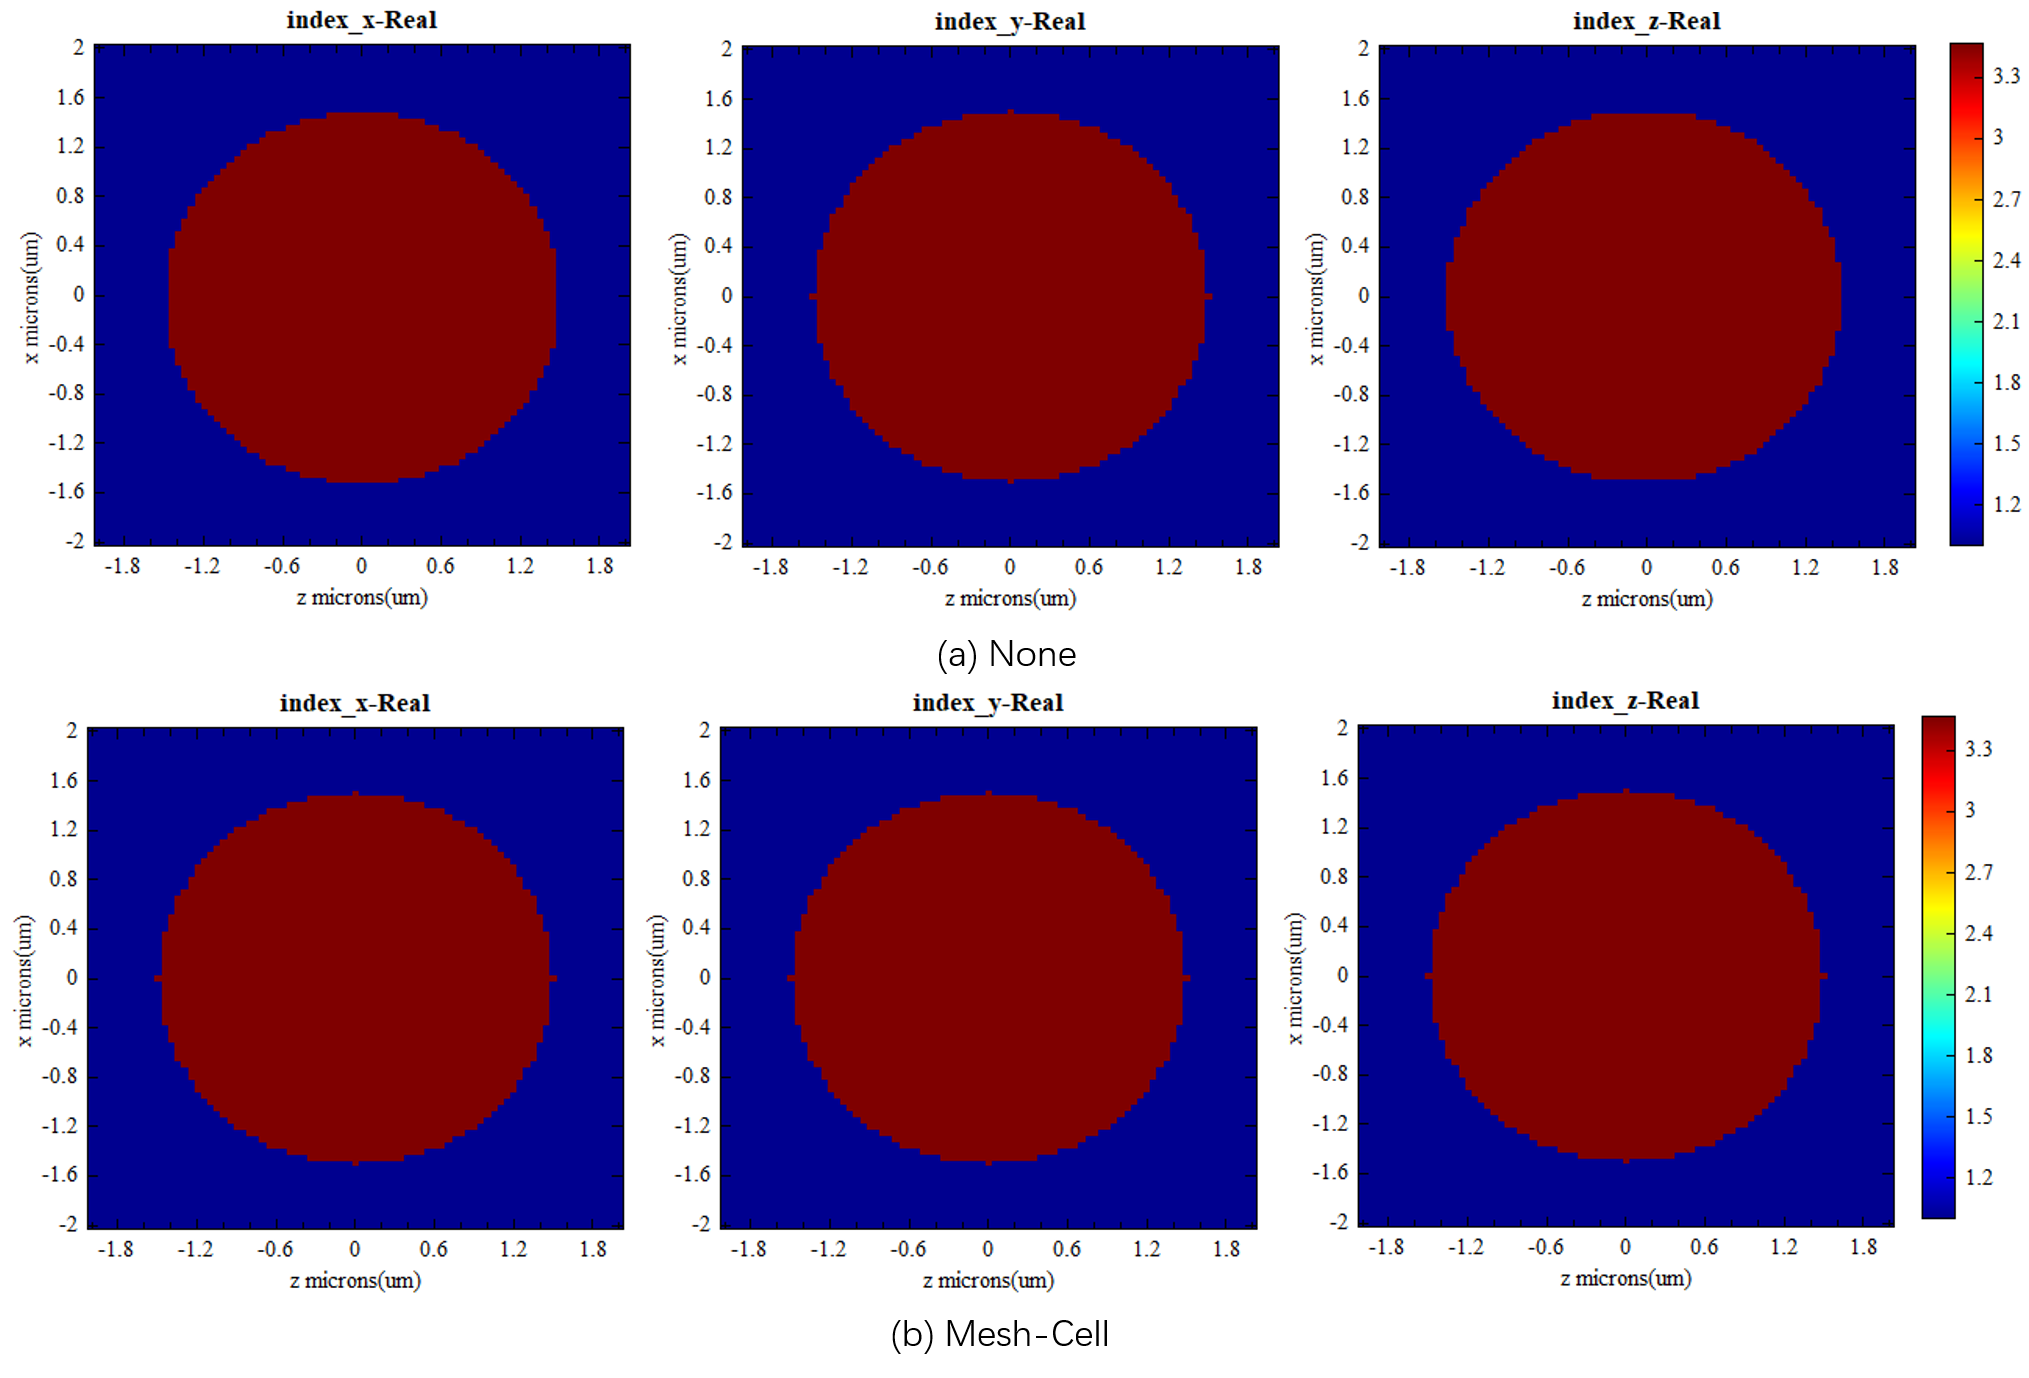
For Index monitor, you can set different Spatial interpolation:
The following images depict refractive index distribution with Spatial interpolation set as None and Mesh cell for Index monitor:
| Name | Description |
|---|---|
| Per # of dx/dy/dz | Sampling interval in the X/Y/Z directions, i.e., after how many discretization steps a sampling is performed. |
Geometry is the tab for setting geometric dimensions of Index monitor. Please refer to geometric dimensions setting of the monitor.
Wavelength/Frequency tab is used to set bandwidth range and number of frequency points for Index monitor.
When Base on source setting is checked, the wavelength/frequency range option on the tab exhibits wavelength/frequency range of the light source, and wavelength/frequency range setting tab is in read-only mode.
When Base on source setting is unchecked, wavelength/frequency range option on the tab can be customized.
Edit simplified settings is a simplified way to customize wavelength range for the monitor.
Edit complicated settings is a complicated way to customize wavelength/frequency range for the monitor.
After completing simulation, view returned results in the Data visualizer of Index monitor. Returned result includes:
In Data visualizer of Index monitor, view refractive index distribution of structure using the following steps:
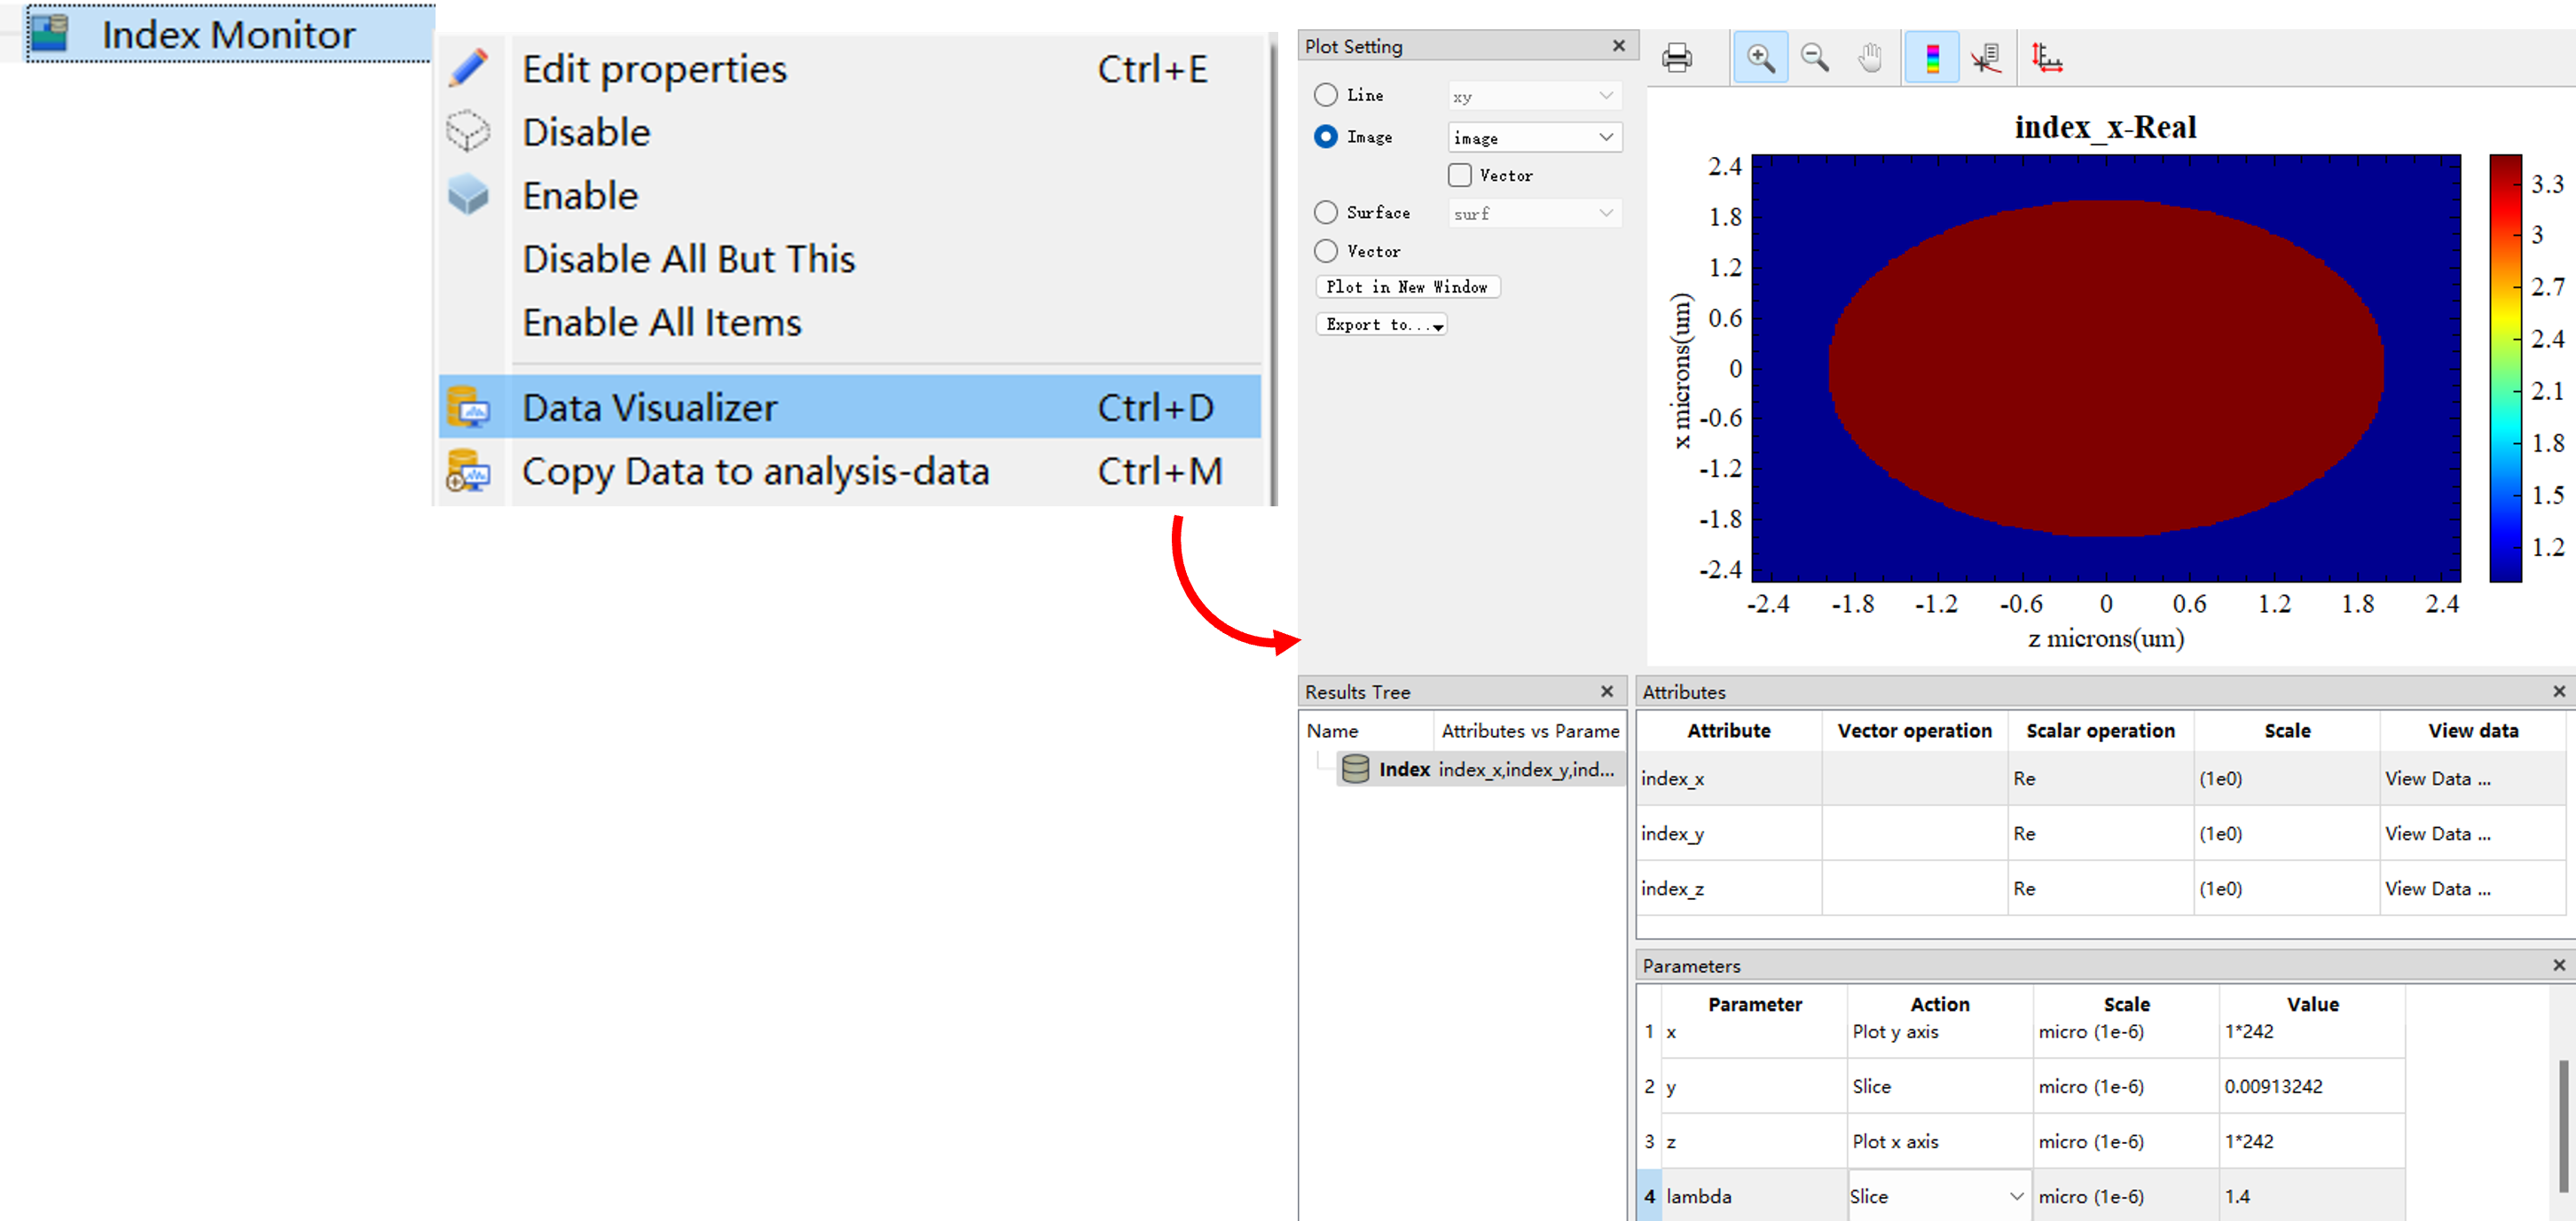
On Visualizer page, you can perform operations such as selection, plotting, and saving of data. Please refer to Data Visualizer for details.
The special microring resonator structure in the silicon-based waveguide microring resonator has the function of wavelength selection compared to other waveguide structures. In this case, Index monitor is used to record the spatial refractive index distribution of this structure. For detailed information, please refer to the Silicon-based dual straight waveguide microring resonator model.

