Products
Solvers
Learning Center
Application Gallery
Knowledge Base
Support
License Agreement
Release Notes
Update and New
English
中文
Contact Number
+86-13776637985
Email
info@simworks.net
 Enterprise WeChat
 WeChat Service Account
The software interface adopts the Ribbon style, integrating multiple tabs with different functions into the menu bar in the upper left corner of the software. Adding solvers and running projects generates new highlighted tabs. These different tabs contain relevant commands and icons, making it convenient for users to use different functions in a targeted manner. The tabs are divided into several sections, allowing users to make more detailed settings. The software main GUI is shown below:

Explanation:
| Number | Name | Description |
|---|---|---|
| 1 | Objects tree | Contain a tree of structures, solvers, sources, monitors, etc. See Objects Tree. |
| 2 | Watch | Provide a quick view of the properties/datasets of selected components. |
| 3 | Optimizations and sweeps | See Optimizations and Sweeps. |
| 4 | Script file editor | Write script programs. See Scripts. |
| 5 | Script console | Run script commands. See Scripts. |
| 6 | Script workspace | Store variables created through the command line. You can edit, save, and delete variables. See Scripts. |
| 7 | Global variables | Define global variables. See Global variables. |
| 8 | Composite viewer | It is in 3D CAD window. See CAD. |
In addition to the area marked by the serial number in the figure, the software also provides shortcut buttons for Save, Undo, Redo, and other operations in the menu bar in the top right corner. The user can freely select the shortcut button to be displayed from the drop-down menu. To the right of the login avatar, the user can choose to hide the entire menu bar. Finally, the software also provides the background color switching function for a theme, allowing users to switch between dark and light colors as required, making the software experience more pleasant and interesting.
Title bar format:
Project name - [Project path] - Software name
The ribbon is located above the main interface of the software. The ribbon contains all the project file settings, GUI settings, simulation settings, and so on.
| Name | Description |
|---|---|
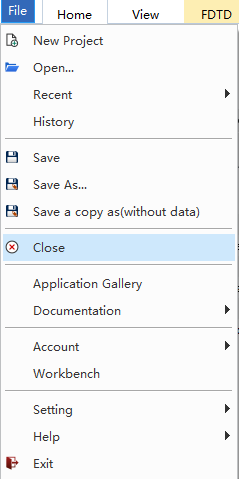
| File | Click to display the application menu, which includes relevant options for project file settings; |
| Home | The main tab contains global functions such as the clipboard, as well as buttons for adding material, solvers, and more; |
| View | The tab for window view is used to configure the visual display in the composite viewer. You can make changes here to meet your personalized needs; |
| FDTD/FDFD/FDE | The highlighted tab generated after adding the solver. Depending on the added solver, the functions and settings in the tabs may vary slightly. It is worth noting that a project can add multiple solvers, but only one solver can be enabled at the same time; |
| Simulation control panel | The simulation control panel displays the details of FDTD/FDFD simulation process and controls the visualization of the time-domain field. |
| Name | Description |
|---|---|
| New project | Create a new project file; |
| Open | Open the project file; |
| Recent | Recently opened project files; |
| History | Simulation history records; |
| Save | Save the current project file; |
| Save as | Save the project as a new one; |
| Save a copy as(without data) | Save as a copy project without result data; |
| Close | Close the current project; |
| Application Gallery | Link to the Application Gallery; |
| Documentation | Link to knowledge base, the dropdown list includes User Manual and Script Commands; |
| Account | Account login; |
| Workbench | Cloud Computing Workbench; |
| Setting | Include auto backup files, Physical Units, and Pulse Normalization; |
| Help | The drop-down menu includes settings for automatic software updates and viewing current software version information; |
| Exit | Exit the software. |

| Name | Description | |
|---|---|---|
| Copy | Copy various components other than the solver, such as structures, sources, analysis groups, etc.; | |
| Clipboard | Paste | Paste the copied components; |
| Photonic crystal | Add photonic crystal structure. | |
| Edit properties | Edit the selected component properties; | |
| Edit tools | Delete | Delete the selected component; |
| Select all | Select all components. | |
| Materials | Materials | Add the material needed for the project in the built-in material library, please refer to the Material. |
| FDTD | Add FDTD solver, please refer to the FDTD Solver Settings; | |
| Simulation | FDFD | Add FDFD solver, please refer to the FDFD Solver Settings; |
| FDE | Add FDE solver, please refer to the FDE Solver Settings. | |
| Structures | Add structures to the project in the built-in structure library. The structure library adopts the In-Ribbon library format. Click the dropdown button to expand the display, please refer to the Structures; | |
| Structures | Import | Import structure files, please refer to the Import and Export; |
| Export | Export structure files, please refer to the Import and Export. | |
| Group | Create a Group; | |
| Group | Structure Group | Create a structure group, please refer to the Custom Structure Group; |
| Structure library | Add the structure group needed for the project in the built-in structure group library, please refer to the structure group. | |
| Jobs | Jobs | Add jobs, and multiple simulation jobs can be added at the same time. |
| Cloud | Cloud | Used to select computing resources for cloud computing, please refer to the Computing Resources. |
| Preference | Preference | Click to pop up the preferences window, including theme switching, form styles, CAD background settings, automatic backup, automatic updates, cloud computing account management, and other functions. |

| Name | Description | |
|---|---|---|
| Working grid | Show working grid | Click to display the background grid lines in the composite viewer, click again to cancel the display; |
| Edit working grid | Set parameters for the background grid lines. | |
| View simulation mesh | Click to display the simulation results of mesh partition, click again to cancel the display; | |
| Simulation memory | Recalculate simulation mesh | Update the display of mesh partition results; |
| Check simulation memory | Check the required memory size for simulation, please refer to the Memory Preview before Simulation; | |
| View the current mesh data | View the spatial distribution of refractive index under the current mesh partition. | |
| Data visualizer | Mode expansion | Set FDFP monitor and port mode expansion, please refer to Mode Expansion; |
| Data visualizer | Display the result of the selected object, please refer to Data Visualization. | |
| Layout | Windows | Click to pop up a context window. The context popup contains check boxes for all modules on the main page. Users can enable the required display modules to customize their main page. In addition, users can switch between Ribbon and Classic style in the Window style. |
| View options | View options | Adjust the visual effects of composite viewer, such as color, transparency, etc. Please refer to Visual Effects. |
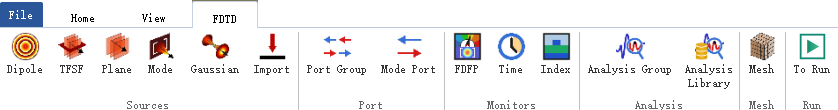
| FDTD | Name | Description |
|---|---|---|
| Dipole | Add a dipole source, please refer to Settings for Dipole Sources for specific settings; | |
| TFSF | Add a Total-Field Scattered-Field source, please refer to Settings for TFSF Sources for specific settings; | |
| Sources | Plane | Add a plane source, please refer to Settings for Plane for specific settings; |
| Mode | Add a mode source, please refer to Settings for Mode Sources for specific settings; | |
| Gaussian | Add a gaussian source, please refer to Settings for Gaussian Sources for specific settings; | |
| Import | Add an import source, please refer to Settings for Import Sources for specific settings. | |
| Port | Port group | Add a port group and continue adding the port for use. The port can serve as both a mode source input and a monitor output. In a port group, only one port can be selected as the input for the mode source. Please refer to Port Setting for specific settings; |
| Mode port | Add a port in the a port group. The port can be used for mode solving as a mode source, and can also be used as a FDFP monitors to record results. With the S-matrix sweep, the complete S-parameters of the device can be obtained. Please refer to Port Setting for specific settings. | |
| FDFP | Add a FDFP monitor, please refer to FDFP monitor for specific settings; | |
| Monitors | Time | Add a time monitor, please refer to Time monitor for specific settings; |
| Index | Add an index monitor, please refer to Index monitor for specific settings. | |
| Analysis | Analysis group | Add an analysis group where users can set their own variables and scripts, please refer to Analysis group for specific settings; |
| Analysis library | Offer the built-in analysis library where users can select the analysis groups based on their needs. Please refer to Analysis Library. | |
| Mesh | Mesh | Add a custom mesh, please refer to User Mesh for specific settings. |
| Run | To run | Prepare to start simulation, generate and enter highlighted tab FDTD Simulation Control Panel. |
The FDFD solver calculates the spatial distribution of electromagnetic fields at the target frequency by solving the frequency-domain Maxwell's equations. Compared to FDTD solver, it cannot use time monitors and related analysis groups. The other components are basically the same, without being further elaborated here.
The FDE solver calculates the spatial mode field distribution of a structural by solving Maxwell's equations on the cross-section. It does not require adding additional components, and the relevant results are displayed in the eigenmode workbench.
| FDE | Name | Description |
|---|---|---|
| Mesh | Mesh | Add a custom mesh. |
| Run | To run | Enter the eigensolver workbench. |
| Dock | Show/Hide Eigensolver workbench | - |

The status bar includes:

