
/
数据可视化
数据可视化窗口绘图类型
数据可视化 #
本节是关于数据可视化的介绍。
数据可视化,在数据可视化窗口实现对数据的选取、绘制和保存等。
数据可视化 #
数据可视化,可以直接展示复杂的高维数据及坐标系统,满足对数据的检查、展示等需求。
通过界面操作打开可视化窗口,该窗口集成了丰富的绘图方式和所选对象的数据集列表,可以非常方便地实现数据的可视化。
对象树 #
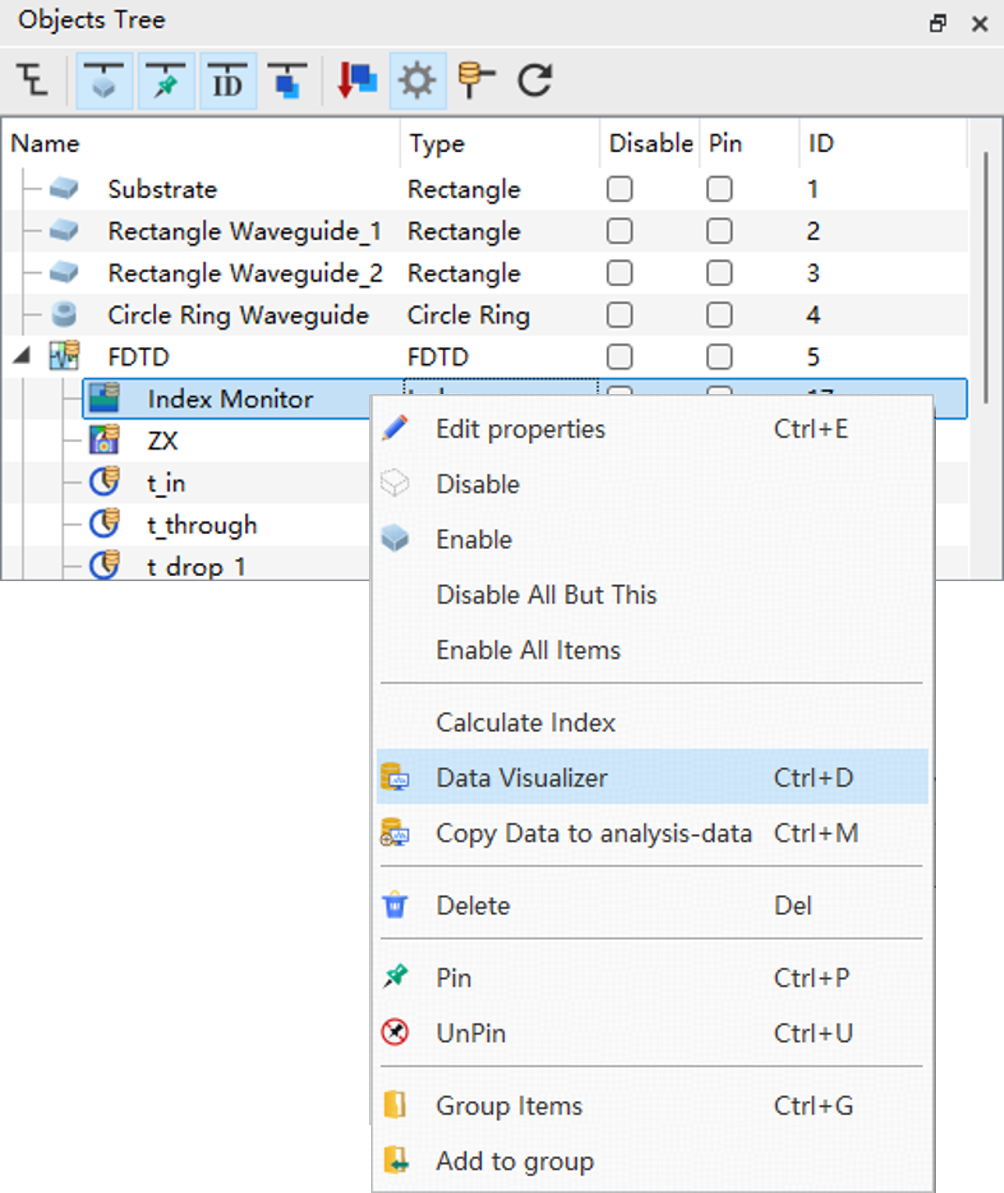
在对象树中右键点击需要查看数据的对象,在弹出的窗口点击Data visualizer打开数据可视化窗口。
Watch查看器 #
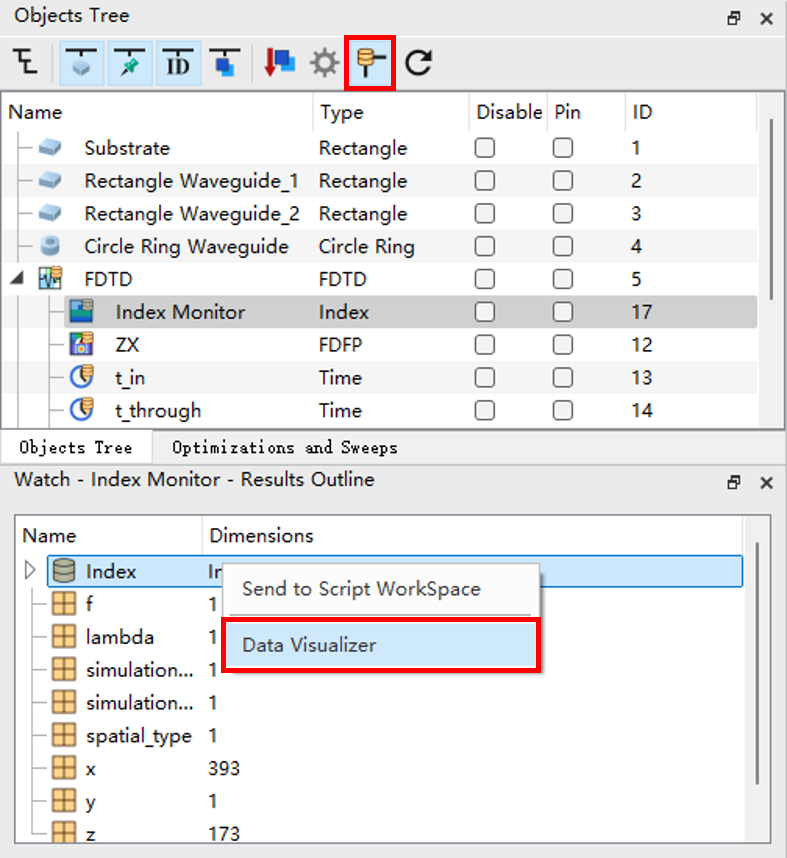
对于对象树中需要查看数据的对象,还可以点击对象树窗口上方的Watch results outline选项,将Watch窗口切换为展示所选对象的数据集列表。再右键点击对应的数据,在弹出的窗口点击Data visualizer即可打开数据可视化窗口。
脚本空间 #
在脚本空间中右键点击需要查看的数据,在弹出的窗口点击Data visualizer打开数据可视化窗口。

实现方式 #
数据可视化窗口 #
窗口组成 #
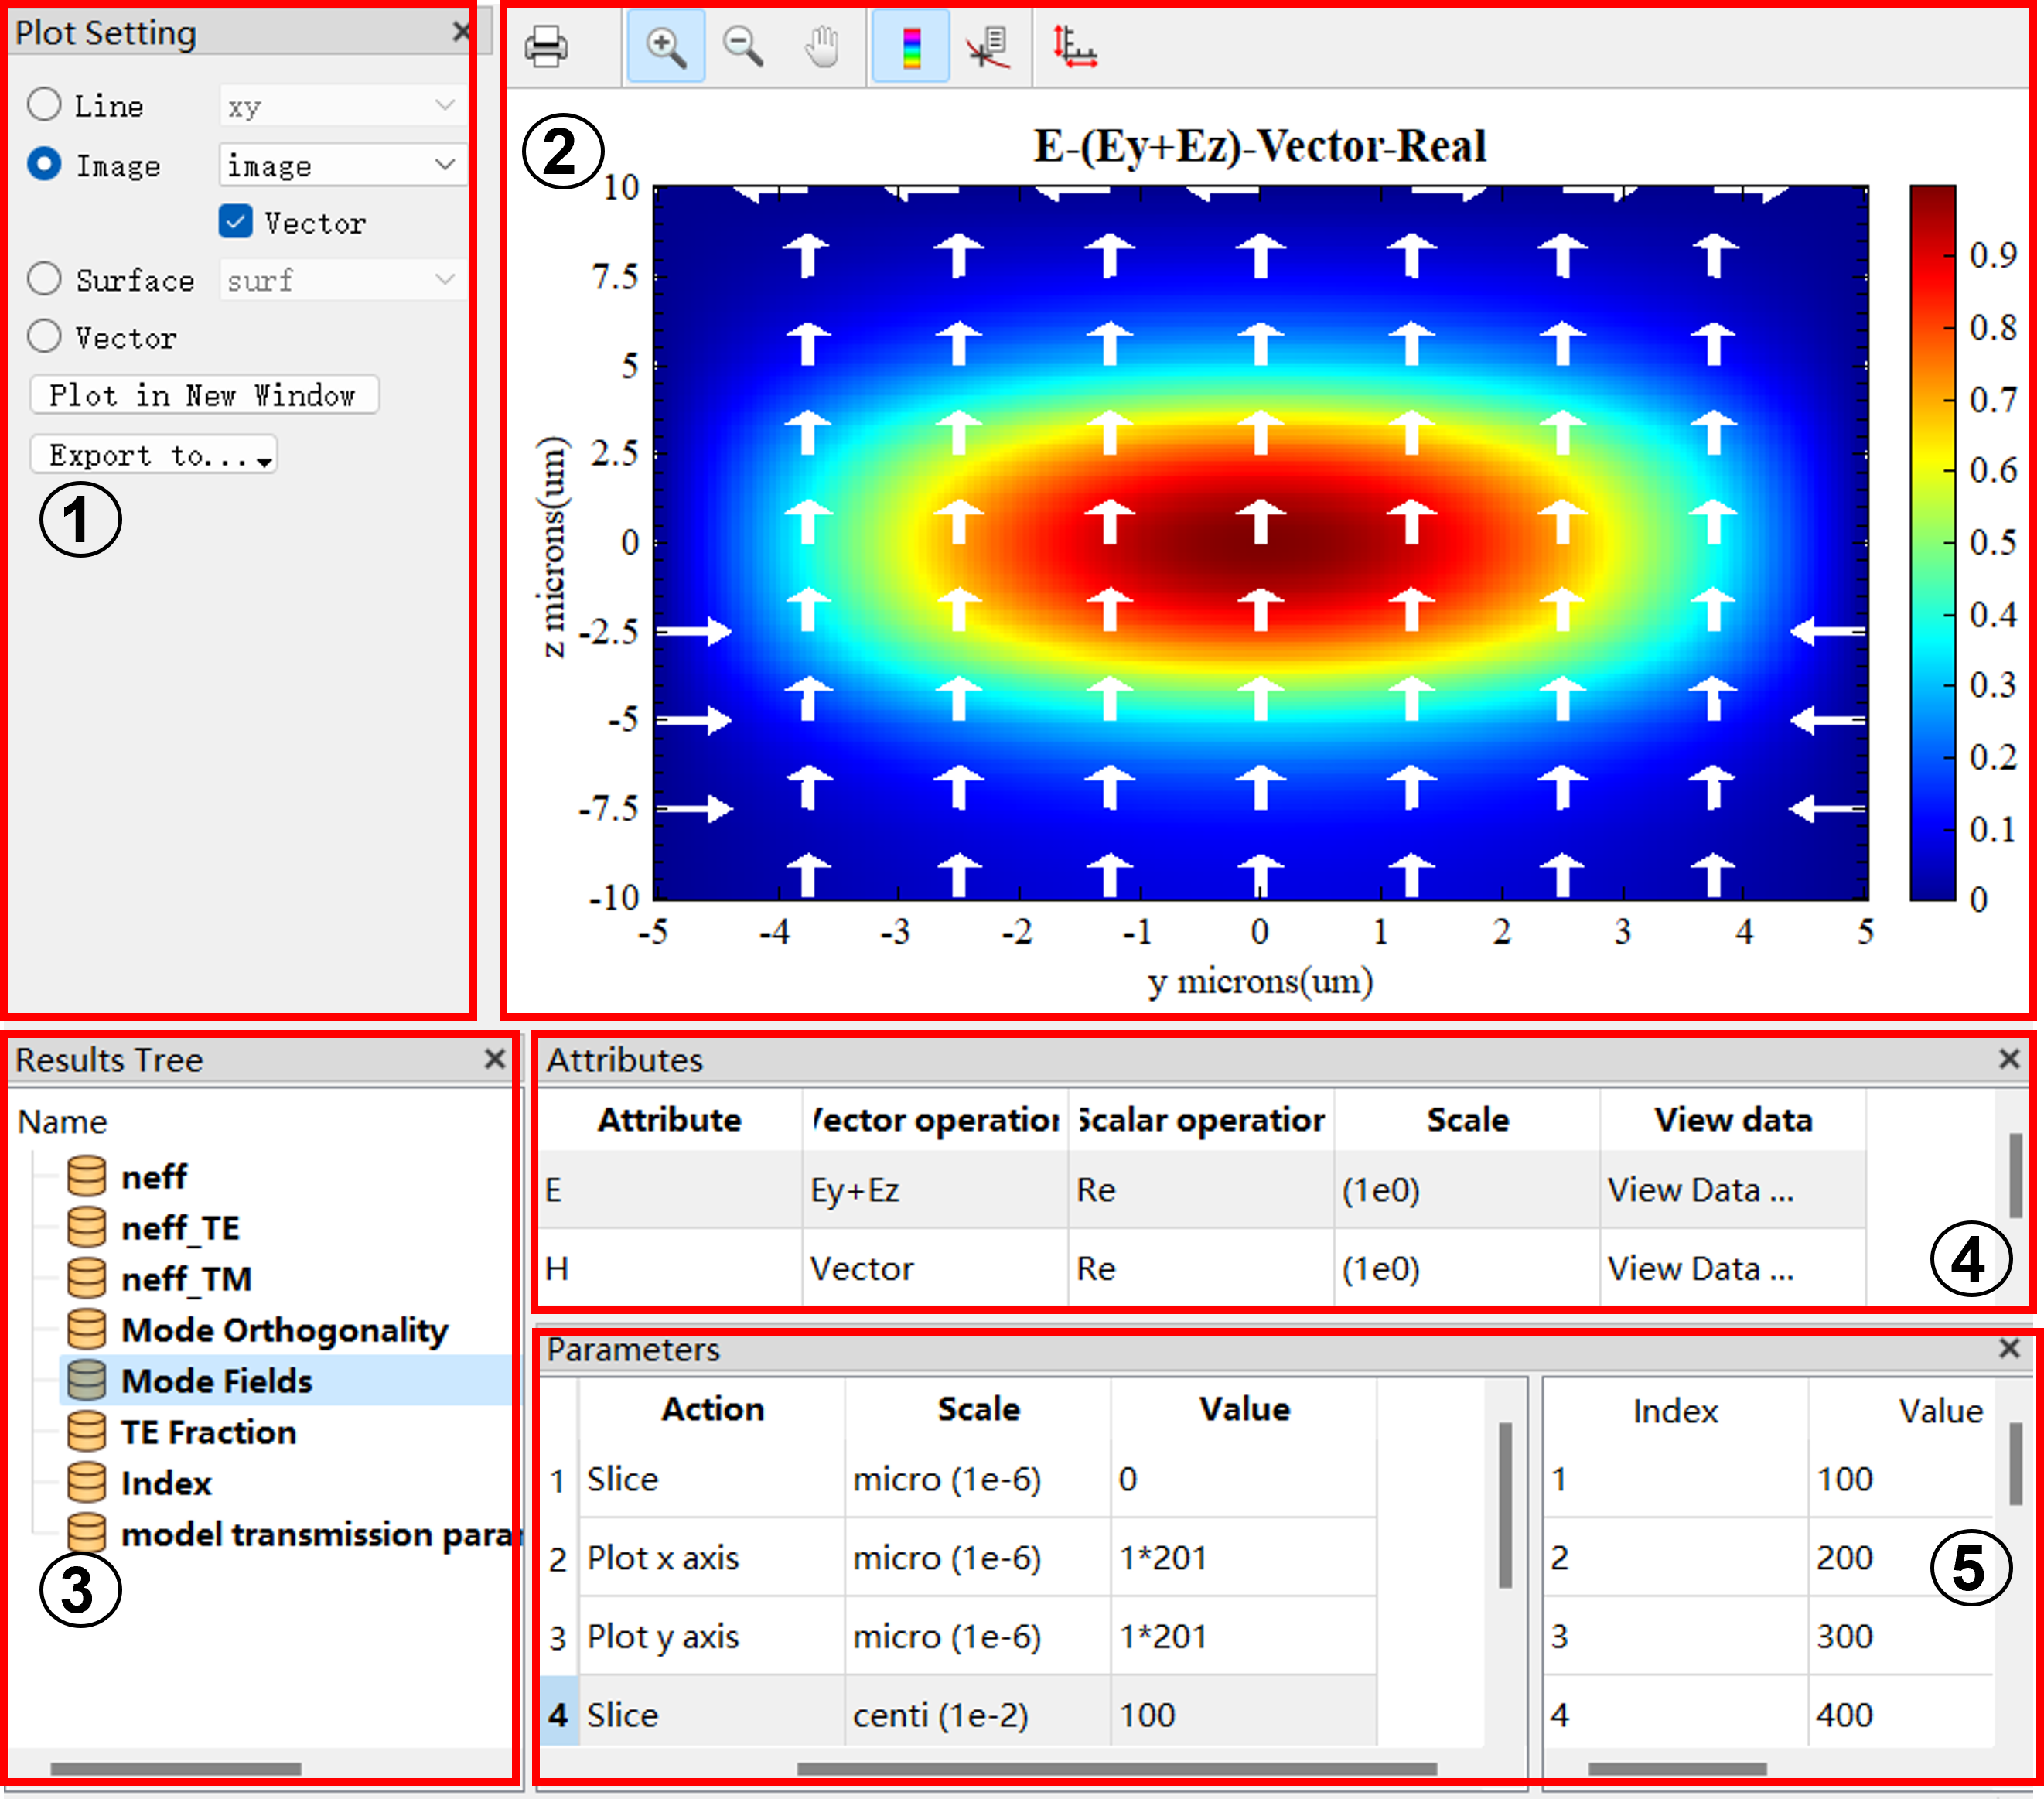
| Number | Name | Description |
|---|---|---|
| 1 | Plot setting | 指定绘图类型和导出。 |
| 2 | Plot | 图像窗口。 |
| 3 | Results tree | 结果树;选择绘图的数据集。 |
| 4 | Attributes | 属性;选择分量、实部、虚部等。 |
| 5 | Parameters | 参数;选择绘图的参数。 |
窗口操作 #
-
Plot setting
通常,绘图类型会根据数据维度自动选取,比如一维数据集将被绘制为 1D 线图;二维数据集被绘制成二维平面图;三维及更高维数据集,自动“切取”二维数据集,以图像方式展示。二维的矢量箭头图需要选择Image>Vector绘制,三维的矢量箭头图选择Vector 绘制;
注意:surf函数是空间曲面的绘制,展示的数据仍要求为二维数据。 -
Attributes
可查看的数据属性包括:- 矢量的各个分量,例如 E 的 Ex、Ey、Ez;
- 数据的实部、虚部、绝对值或者相位等参数。例如 Ex 的实部是 real(Ex),虚部是 imag(Ex),绝对值是 abs(Ex),相位是 angle(Ex)。
更多 #
可视化方式 #
软件支持丰富的可视化方式,主要包括:
| Name | Description | Figure | More |
|---|---|---|---|
| Plot | 一维线图 | 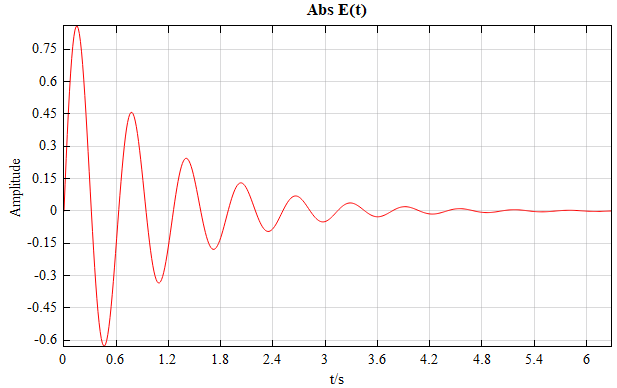 取对数: 取对数: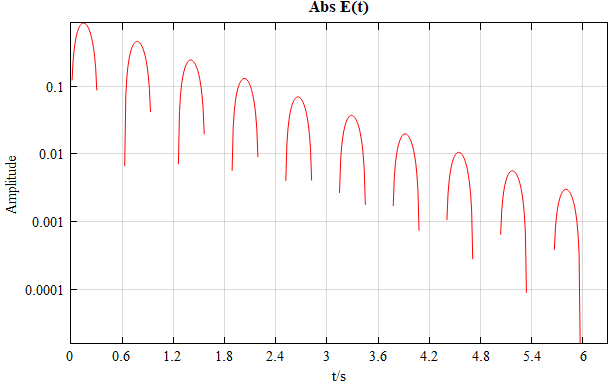 |
线图 |
| Plotyy | 一维双 y 轴线图 | 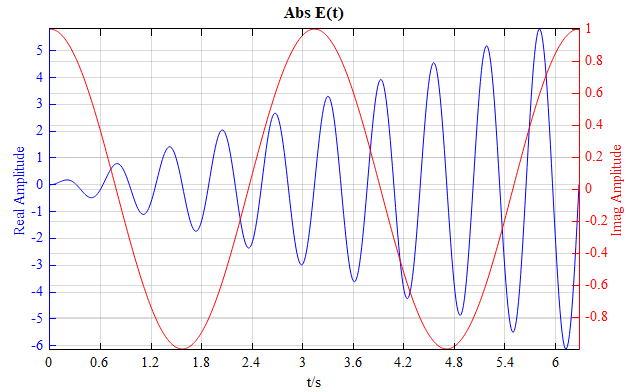 |
双线图 |
| Polar | 一维极坐标图 | 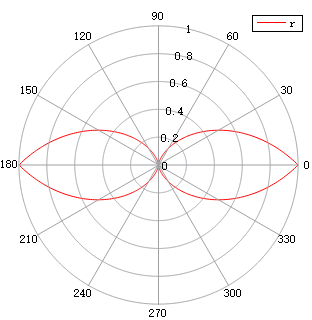 取对数(注意调整径轴的范围): 取对数(注意调整径轴的范围):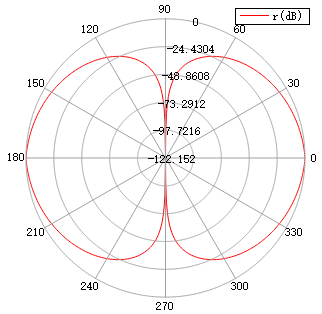 |
极坐标图 |
| Smith chart | Smith 图 | 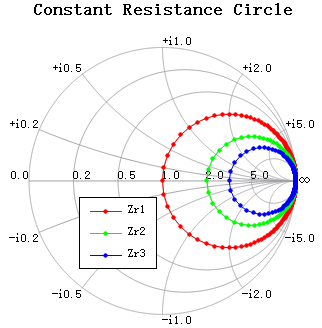 |
Smith 图 |
| Image | 二维平面图 | 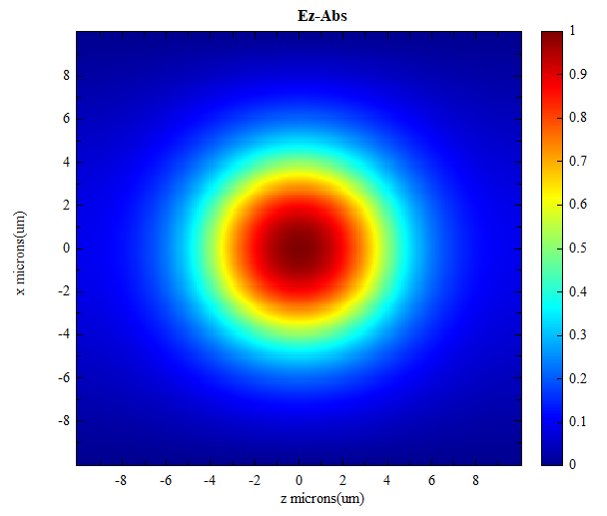 取对数: 取对数: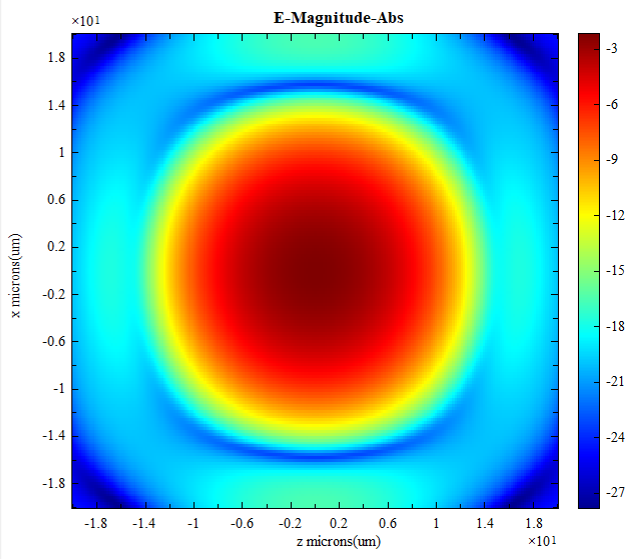 添加横向矢量: 添加横向矢量: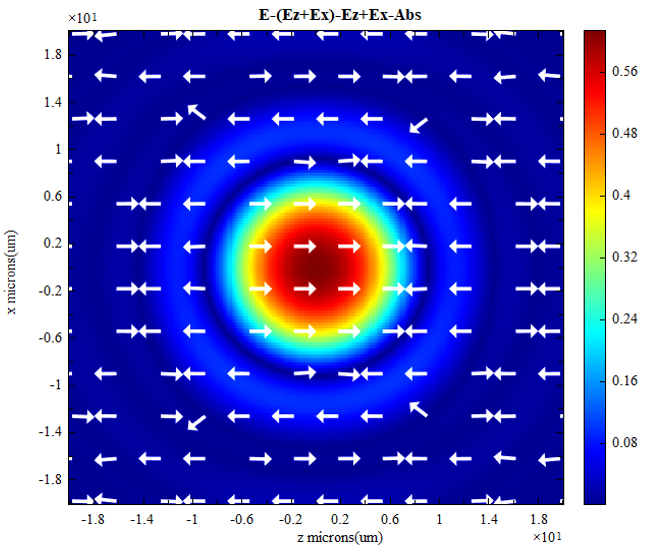 |
二维图 |
| Surf | 三维空间曲面图 | 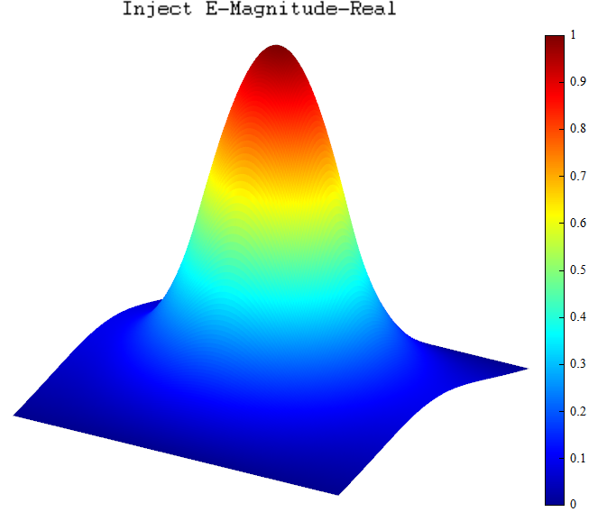 取对数: 取对数: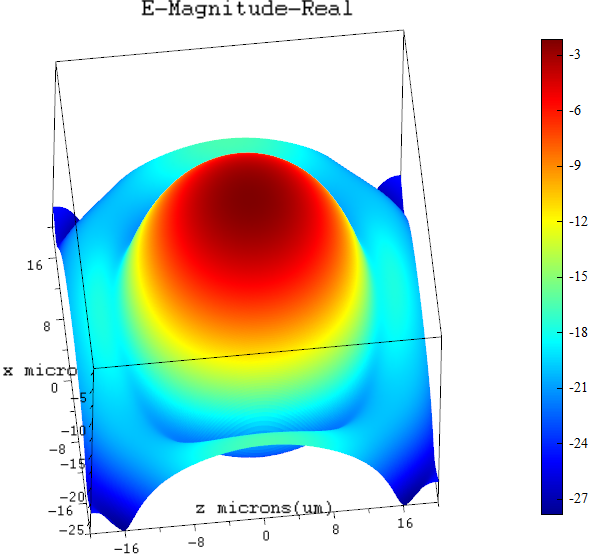 添加网格: 添加网格: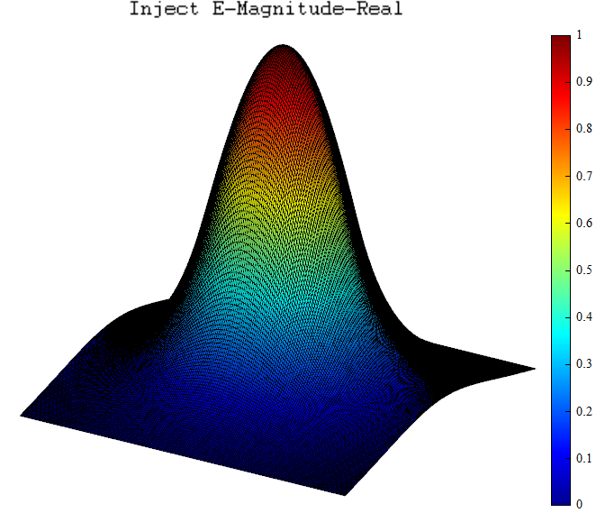 辐射图: 辐射图: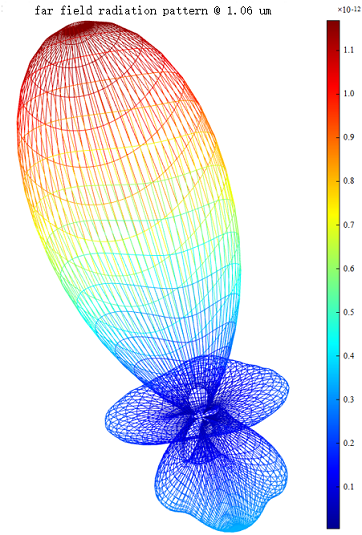 |
三维图 |
| Mesh | 三维空间网格图 | 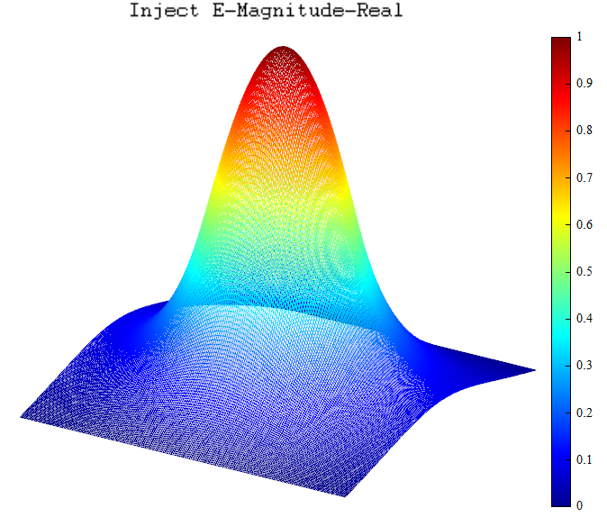 |
三维图 |
| Vector plot | 三维空间矢量图 | 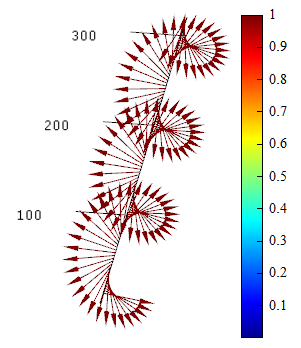 |
三维矢量图 |