反射型滤色器
前言
人眼对特定的光谱产生特定的色觉。反射型滤色器,通过选择性的调控反射光谱使人眼获得不同的色觉。参考 Yang[1]等人的工作,建模仿真了 非对称法布里-珀罗(Fabry–Perot,FP)腔的反射型滤色器。其中 层在太阳光谱范围具有接近完美的吸收(Near-perfect Absorption)效应;选择合适的 层厚度,以阻挡透射;而调整中间层 的厚度,反射光谱将在人眼中产生丰富的高饱和度、高亮度的色觉。本案例展示了如何计算反射光谱对应的色度坐标,并分析了该滤色器的显色调节规律。
仿真设置
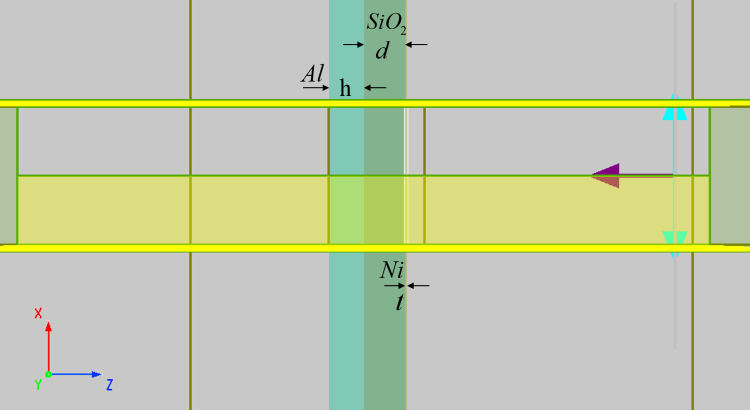
本案例使用 2D FDTD 仿真,该滤色器为简单的三层薄膜结构,顶层为 ,中间层为 ,底层为 ,使用 波段的平面光源,沿 z 轴的负方向垂直入射,来模拟自然光照明,如下图所示。由于结构在 x 轴方向周期展开,且源的偏振与 x 轴方向平行,因此,将X axis min和X axis max设置Anti-Symmetric边界以加速仿真计算。需要注意的是,由于顶层 的厚度较薄,在该层使用自定义网格以细化仿真网格,提高仿真结果的精度。
| 参数名称 | 尺寸 |
|---|---|
材料设置
-
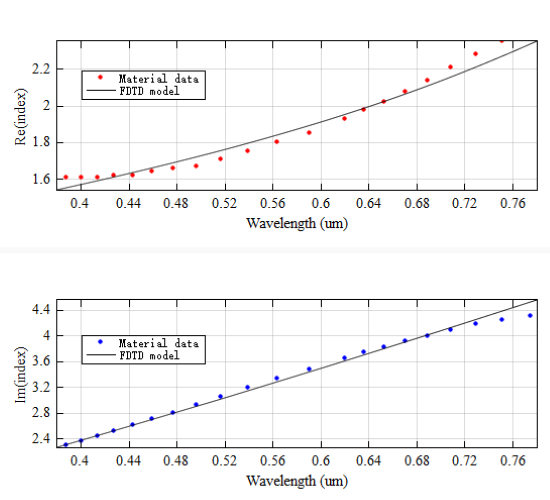
顶层材料来自内置材料库,需要拟合,拟合波段为可见光波段( ),拟合结果所下图所示。
-
中间层为 ,在 波段可近似为介质(Dielectric)材料,折射率为 。
-
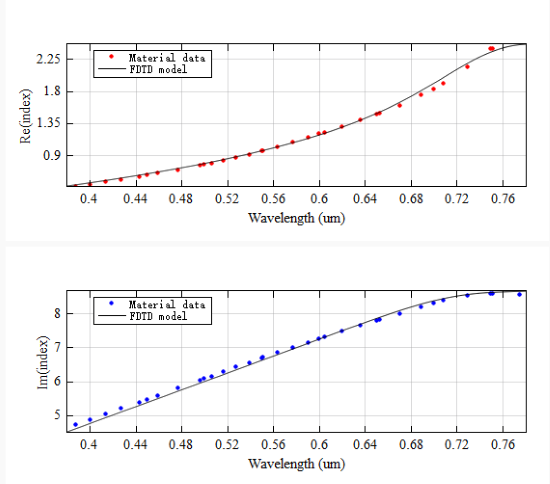
底层材料来自内置材料库,需要拟合,拟合波段为可见光波段( ),拟合结果所下图所示。
仿真结果
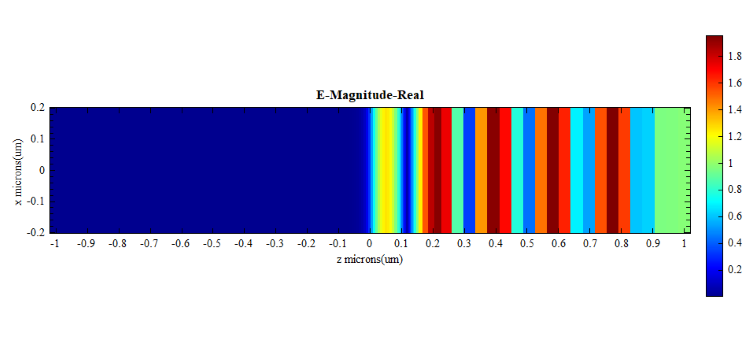
打开并运行附件工程,在FDFP Monitor监视器当中可以得到 全波段的电磁场以及功率等物理量,其中在波长 下的电场分布如下图所示,可以看到,由于 FP 腔效应产生的电场局域增强,使得几乎所有的能量被顶层 吸收,呈现接近完美的吸收效应。同时由于 层的阻挡透射的作用,将电磁波限制在非对称法布里-珀罗腔内。
参数分析
反射率谱和色度图坐标
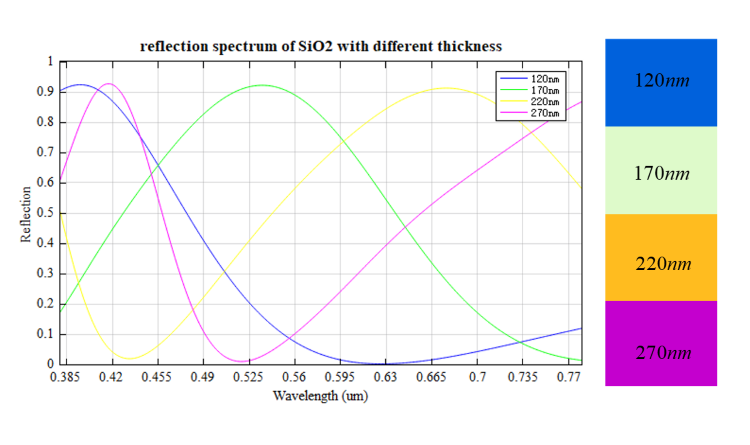
打开附件工程,运行d_120_270_50nm参数扫描,设置中间层 的厚度 分别为 、 、 、 ,其反射率扫描结果如下图所示。运行脚本Reflective_Color_Filters.msf,根据反射率谱,计算得到对应的 CIE 色度坐标,查找色度坐标对应的颜色如图中所示,同时计算反射率谱的波峰分别对应 、 、 、 ,上述结果与参考文献 Figure 1一致。
反射率谱随中间层的厚度扫描
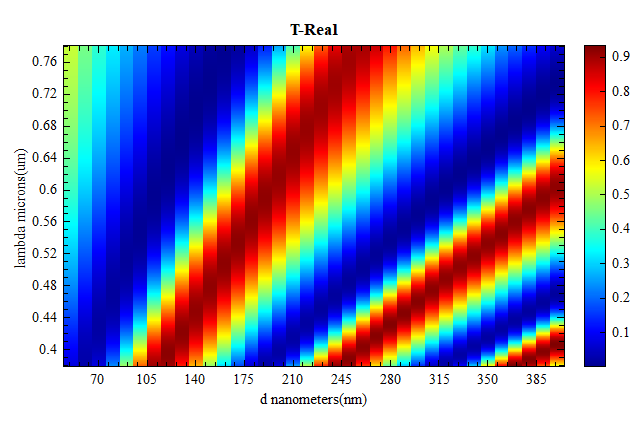
打开附件工程,运行d_50_400_10nm参数扫描,可以得到反射率谱 随 层厚度 的连续变化关系,如下图所示。当厚度 在 时,在可见光波段反射率较低。当厚度 从 连续增加到 时,反射峰的位置从 红移到 。此外,当厚度 超过 和 时,两个高阶模式开始出现在 处。该结果与参考文献 Figure 2一致。
因此,通过改变中间层 的厚度 ,反射峰的位置能够得到连续细调,即该滤色器可以获得覆盖整个可见光范围且具有高饱和度和亮度的色彩。
附录
色度图的轮廓覆盖区显示了自然界一切物理可能颜色的色域范围。根据国际照明委员会(International Commission on illumination,CIE)建立的 CIE 标准色度学系统,反射光谱的色度坐标计算如下:
光谱功率分布为:
是白光光源的相对辐射光谱, 是反射光谱。三刺激值 、 和 是通过以下方法计算的:
, , 是标准观察者函数。积分为可见光 范围, 为归一化常数:
CIE 色度坐标( )可通过归一化得到:
由于对入射光源的强度进行了归一化处理,( )只有两个值是独立的。
参考文献
Yang Z , Zhou Y , Chen Y , et al. "Reflective Color Filters and Monolithic Color Printing Based on Asymmetric Fabry–Perot Cavities Using Nickel as a Broadband Absorber".Advanced Optical Materials,(2016) ↩︎