布拉格微腔
前言
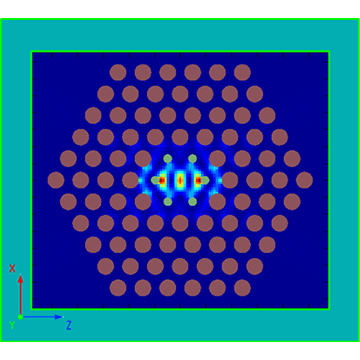
基于光波导的光学微腔具有较高的品质因子,并可以应用于光学滤波器、激光器和调制器等多个领域。本案例使用 FDTD 分析基于光波导的一维布拉格光栅谐振微腔的共振频谱,并计算共振频率和品质因子 Q。模型中的布拉格光栅由齿状周期结构和分布在结构中间的 6 个平行空气平板构成,通过加宽中心结构的尺寸来引入缺陷,使光在布拉格结构的阻带内发生透射共振。
仿真设置
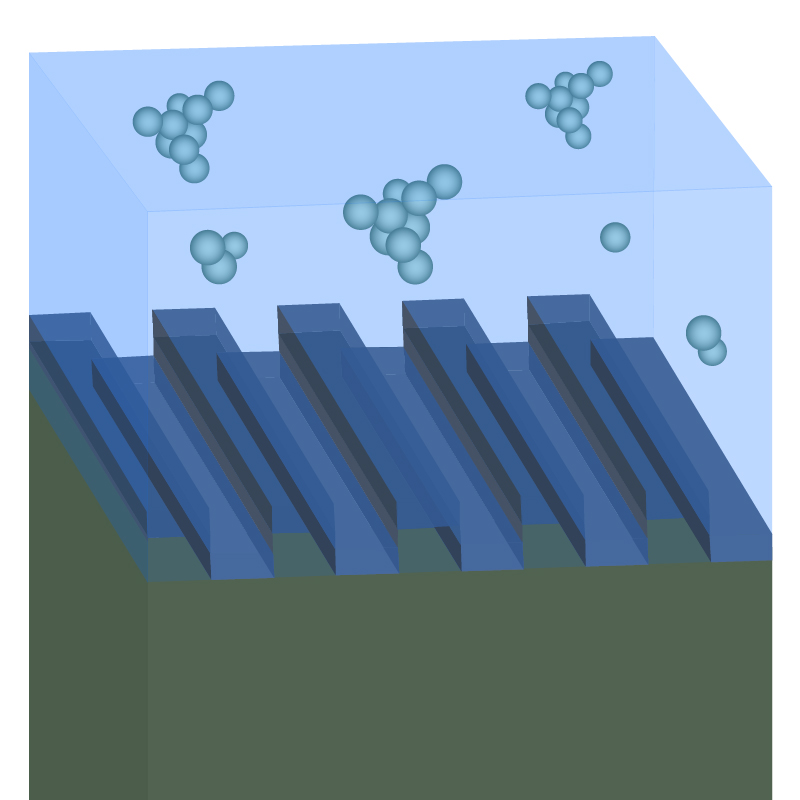
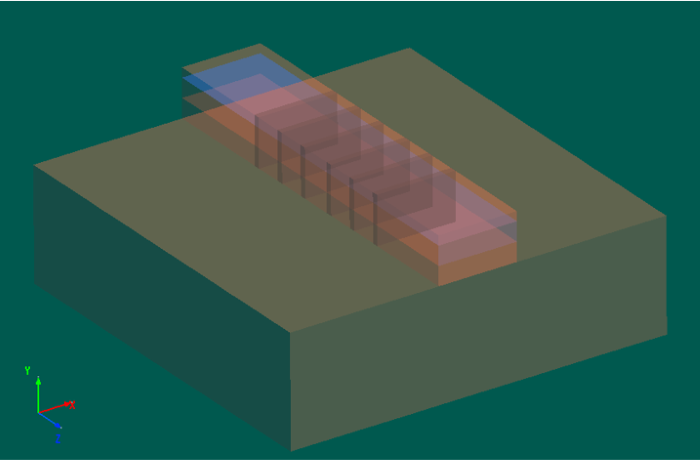
本案例通过使用 3D FDTD 构建了一种典型的基于波导结构的布拉格微腔,其结构如下图所示。为引入缺陷,光栅的尺寸为不均匀设置,具体请参考文献[1]。
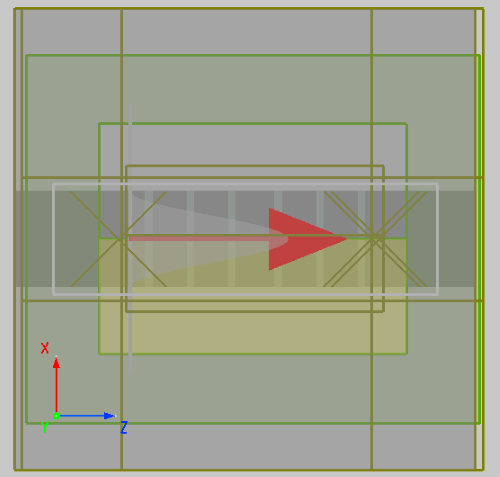
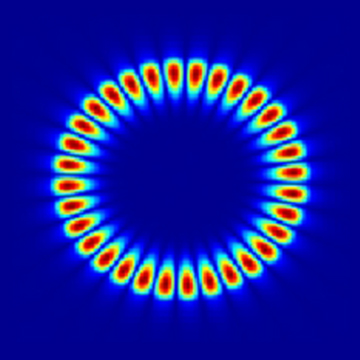
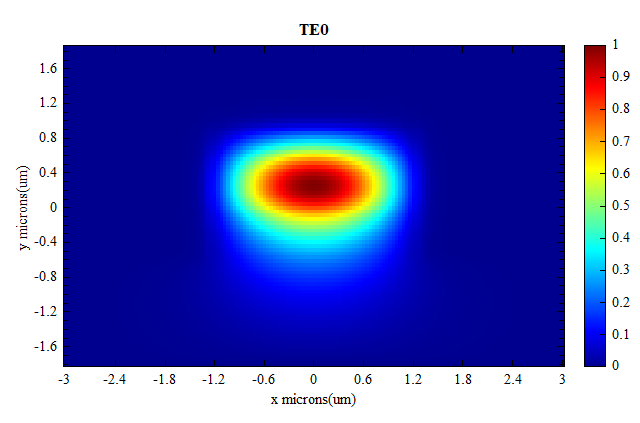
光源使用Mode Source,然后选择注入波导的光模式,本案例中,选择 TE 偏振的基模来激发谐振微腔,其模式轮廓图如下所示。通过在仿真区域中放置多个不同方向及位置的FDFP monitor来观测场分布情况。使用分析组库当中内置的high Q分析组求解目标频段范围内的共振频率,并计算对应的品质因子 Q。
仿真结果
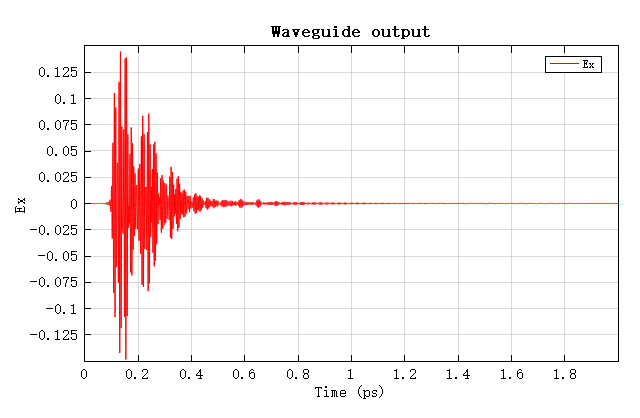
打开附件工程并运行完成后,可从监视器和分析组中得到所有目标分析数据。运行附件中的Waveguide_Bragg_Microcavity_analysis.msf脚本文件,可以得到以下展示数据。如下图所示,从Time Monitor out的结果中 Ex 的信号强度可以看出,大约 1 ps 的时间内,大部分的光能已经辐射,但是为了保证 Q 的计算准确性,需要得到 2 ps 内完整的信号数据。
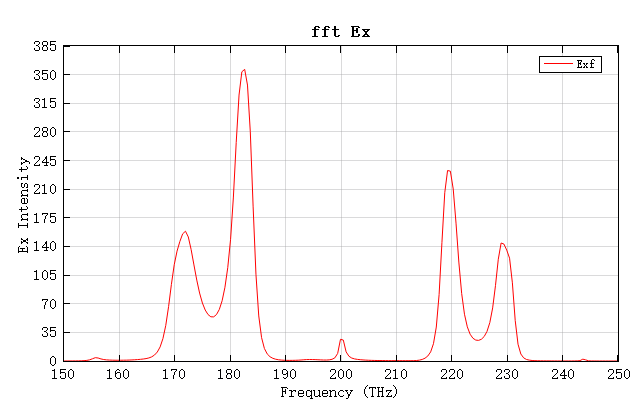
将时域信号进行快速傅里叶变换(Fast Fourier Transform, FFT)后,得到共振频谱图如下图所示,可以明显看出此布拉格微腔具有较宽的阻带,在目标频段范围内存在多个共振峰。
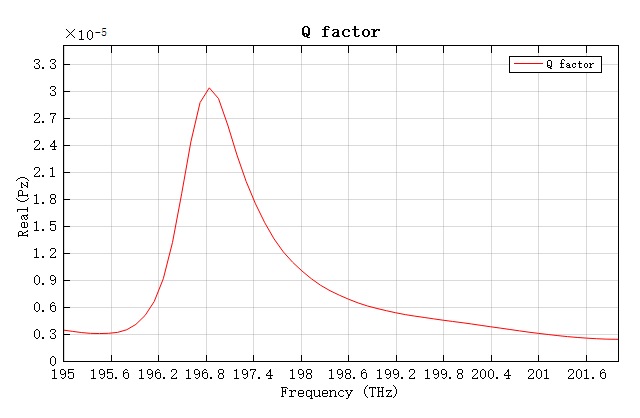
通过下图所示的透射光谱可以看出,共振频率为 196.8 THz。其对应的品质因子 Q(即共振峰中心频率与其半峰全宽(Full Width at Half Maxima, FWHM)的比值)可以从分析组high Q的结果数据中得出,约为 199。由于微腔的品质因子代表能量存储与能量损失的比值,因此要获得更高的品质因子,就必须尽可能减少辐射损失。
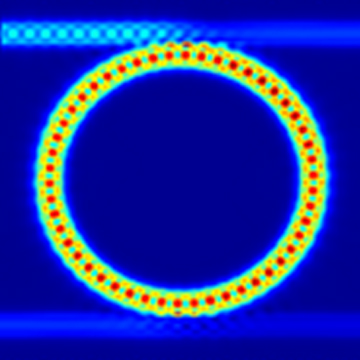
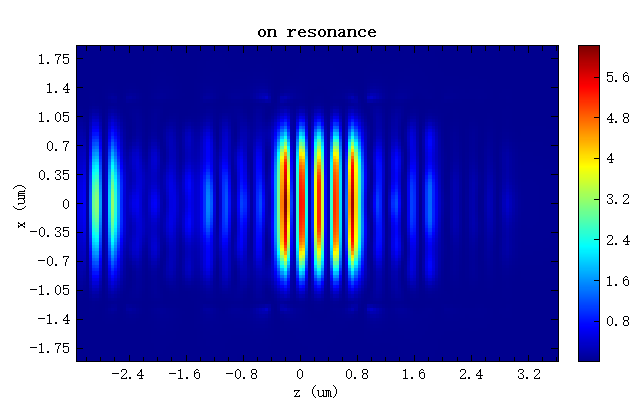
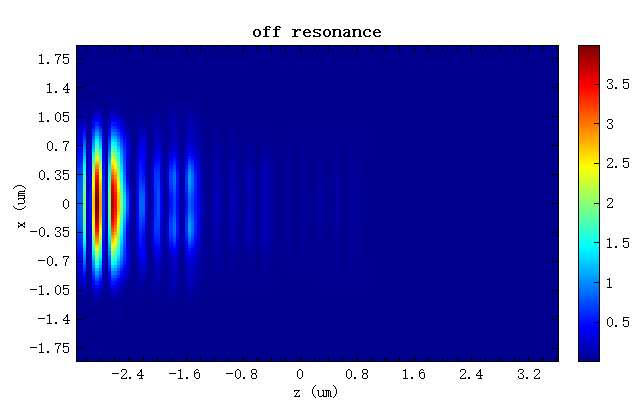
微腔结构的水平和垂直截面位置的 FDFP monitor 记录了不同频率的场强分布情况,在此对比共振频率和无共振频率下的场强分布。从下图可以明显看出,在布拉格微腔位置的共振电场约有六倍强度的增强,另一张图片中展示出,无共振现象发生时,大部分辐射被布拉格微腔结构所反射。
参考文献
Kleckner, T. C , Modotto, et al. "Design, Fabrication, and Characterization of Deep-Etched Waveguide Gratings", Lightwave Technology, Journal of, 2005, 23(11):3832-3842. ↩︎