

Silicon-Based Double-Straight-Waveguide Microring Resonator
Preface
Integrated photonics has become a key enabling technology in fields such as optical communications, sensing, and signal processing. Among various photonic devices, microring resonators are widely used in applications such as filtering, modulation, and nonlinear optics due to their compact footprint, high quality factor, and excellent wavelength-selective properties. To achieve the desired spectral response within the target wavelength range, precise parameter optimization and performance prediction are essential during the design stage. In this case, a microring resonator with a center wavelength of and a free spectral range (FSR) of is designed and simulated.
This document first uses the FDE solver to calculate and , and determines an appropriate microring radius accordingly. Then, with the radius fixed, the 2.5D and 3D FDTD solvers are respectively used to simulate the resonator, obtaining the transmission spectrum from the input port to the drop port and the Q factor. The results are compared with the 3D FDTD simulation results to verify the design accuracy and the reliability of the simulation methods.
Simulation Settings
Device Introduction
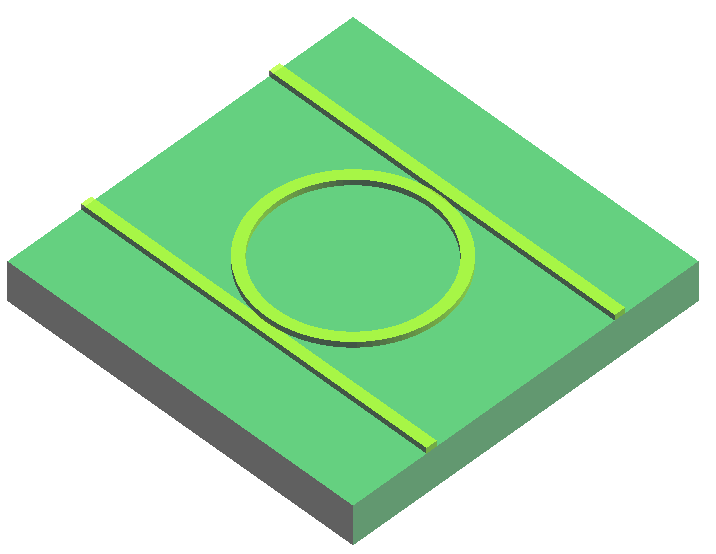
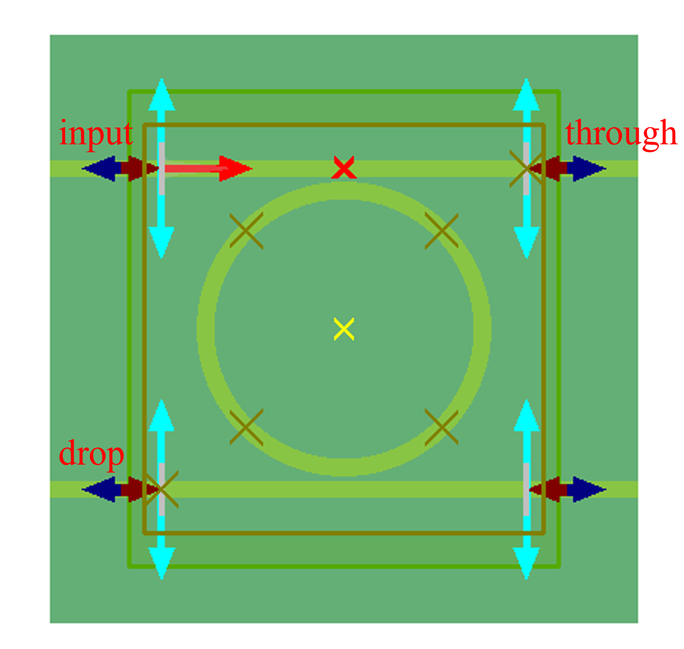
The simulation model used in this case is shown in the figure above. The waveguide structure is a SOI waveguide. The width of the double straight waveguides () is equal to the width of the microring waveguide (), and the waveguide gap is set to .
The design requires an FSR of (corresponding to a wavelength spacing of ) at the center wavelength of . To meet this requirement, the microring radius must satisfy both of the following equations:
Here, and are the effective index and group index at , respectively. The first equation arises from the resonance mode condition of the microring, ensuring that the phase of the optical field satisfies the coherence condition after one round trip in the ring. The second equation comes from the relationship between FSR and ring circumference, ensuring that the resonance spacing meets the design requirements.
Solver Settings
Since silicon is a dispersive medium in the optical band, to ensure the continuity of the material model over the frequency range, the sampled material data sampling type in the FDE solver should be set to use a polynomial material model to fit the material data.

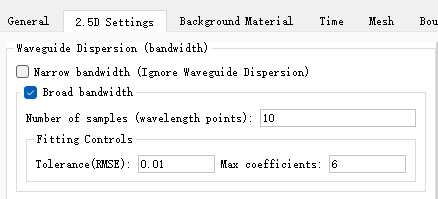
The ring resonator is a high-Q device. To obtain more accurate simulation results, a longer simulation time is required. In this case, the FDTD simulation time needs to be set to 10 ps. In the 2.5D FDTD simulation, since the incident source bandwidth is and waveguide dispersion must be considered, the Broad bandwidth option should be checked in the 2.5D setting tab. In addition, the slab position should be selected at the location of the waveguide. For details, please refer to the instructions in the 2.5D Solver documentation.
Simulation Results
Effective Index and Group Index
Open the attached RingResonator_FDE.mpps project and run the RingResonator_FDE.msf script. The script will automatically set up the FDE solver for mode solving to obtain the effective index and group index at a wavelength of :
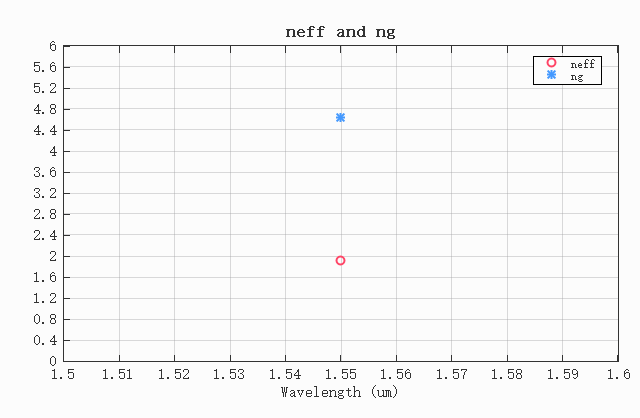
The calculation results show that the effective index and the group index . When , the radii calculated by the two formulas are the closest to each other, and the ring radius at this time is approximately .
Transmission Spectrum at Each Port
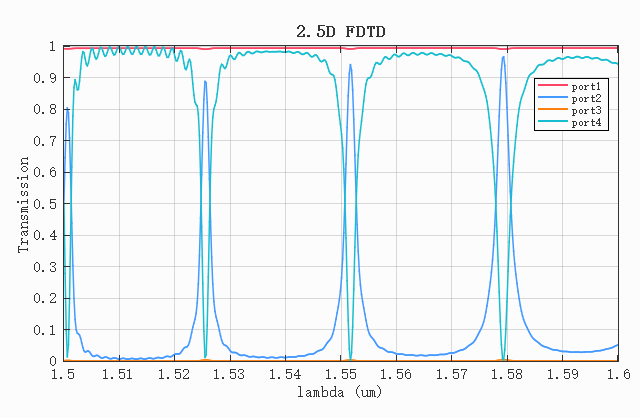
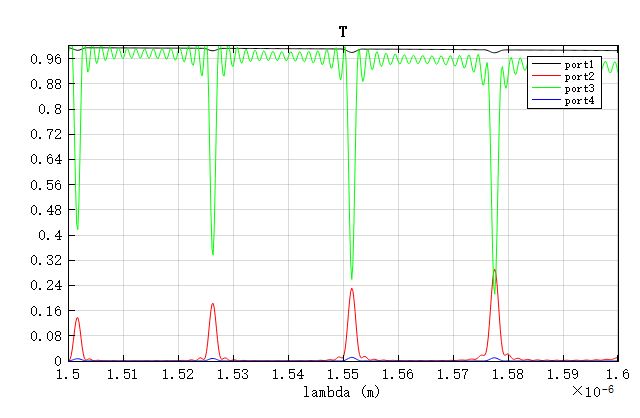
After calculating the ring radius using the FDE solver, open the RingResonator_25d.msf script or the RingResonator_3d.msf script and run it. The script will automatically open the corresponding project, set parameters such as the ring radius and port positions, and perform the simulation. The transmission spectra calculated by the two simulation methods are shown below.
It can be seen that in the 2.5D FDTD simulation results, there are four distinct resonance peaks. Among them, the third resonance peak is located at , which differs from the design value by about 0.11%, verifying the effectiveness of 2.5D FDTD in rapid modeling and analysis.
In the 3D FDTD simulation, there are three resonance peaks, with the central resonance peak located at . Compared with the 2.5D simulation result, it is closer to the design value, indicating that 3D FDTD has an advantage in accuracy. Therefore, the following sections will analyze the 3D FDTD simulation results.
Electric Field Distribution at Resonant Wavelengths
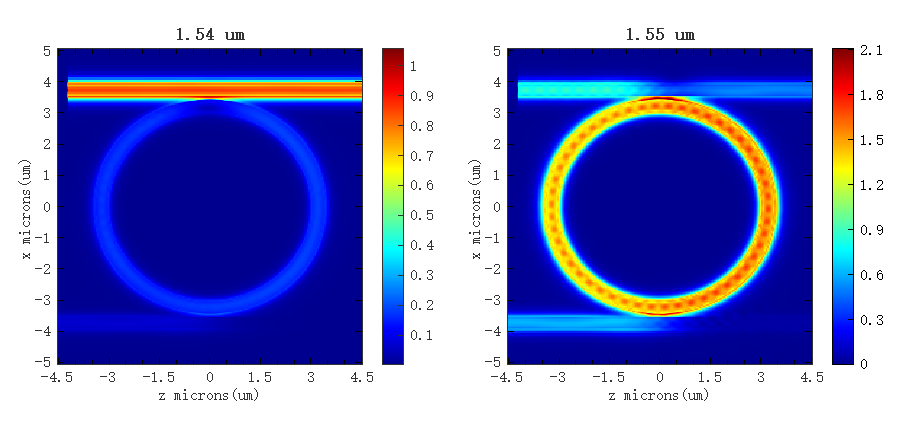
Based on the resonance peak at the output port, view the data of the FDFP monitor ZX. The electric field intensity at the resonance peak is shown in the right figure below. It is evident that compared to the non-resonant wavelength of , the field intensity at the resonant wavelength is significantly enhanced.
Quality Factor
The quality factors (Q) of the three resonance peaks are as follows:
Resonance 1:
    frequency = 196.708 THz, or 1524.05 nm
    Q = 1370.80 +/- 123.5
Resonance 2:
    frequency = 193.477 THz, or 1549.50 nm
    Q = 1036.74 +/- 69.51
Resonance 3:
    frequency = 190.229 THz, or 1575.95 nm
    Q = 789.26 +/- 39.61
Comparison with Theoretical Results
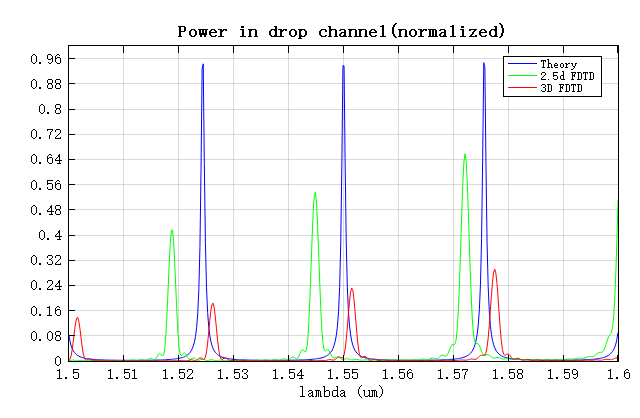
The figure below compares the theoretical spectrum of the port at a center wavelength of and with the simulation results. It can be seen that the FSR agrees well with the theoretical value; under the condition of identical structures, the total transmittance obtained by the 3D FDTD simulation is lower, mainly because the 3D simulation introduces more loss factors; while the resonance peak positions in the 2.5D FDTD simulation have a slight shift, because the 2.5D simulation requires the equivalence of 3D materials to 2D materials, and this process introduces a certain approximation error, resulting in a slight difference in the effective optical length compared to the 3D simulation. The precise position of the resonance peak is extremely sensitive to the effective optical length of the ring resonator. In engineering applications, thermal tuners are often used to compensate for the resonance peak position.
References
[1] Mirza, Asif, et al. "Silicon Photonic Microring Resonators: Design Optimization Under Fabrication Non-Uniformity." Design, Automation and Test in Europe Conference and Exhibition 2020.
[2] Zhou Z P. Silicon Based Optoelectronics. Peking University Press, 2012.
[3] Hammer, Manfred, K. R. Hiremath, and R. Stoffer. "Analytical Approaches to the Description of Optical Microresonator Devices." Aip Conference Proceedings (2004).